. 2017 Oct 3:7:38.
doi: 10.4103/jcis.JCIS_40_17. eCollection 2017.

Magnetic Resonance Imaging Appearance of Schwannomas from Head to Toe: A Pictorial Review

Affiliations

Magnetic Resonance Imaging Appearance of Schwannomas from Head to Toe: A Pictorial Review

Jamie Crist et al. J Clin Imaging Sci. .

Abstract

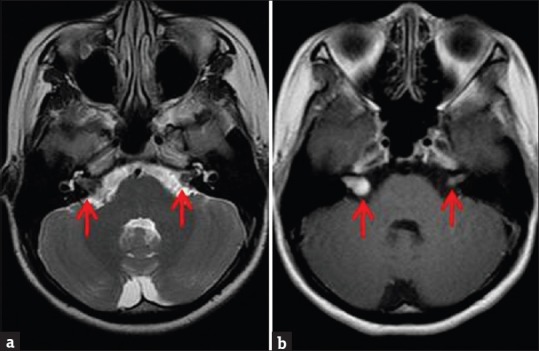
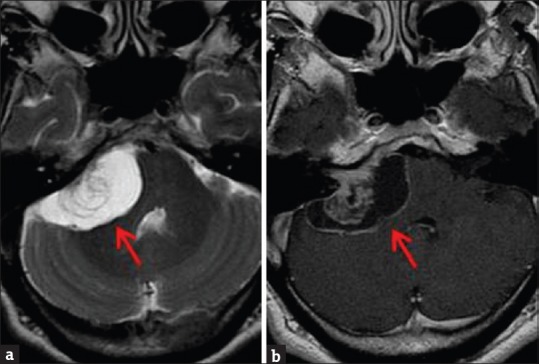
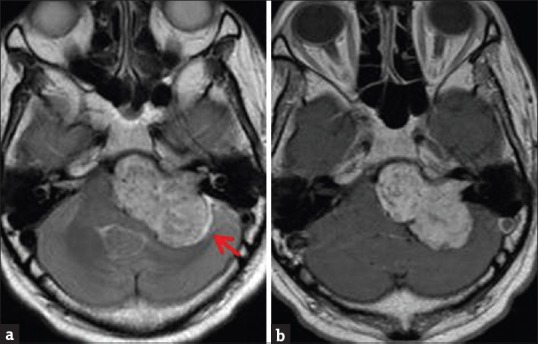
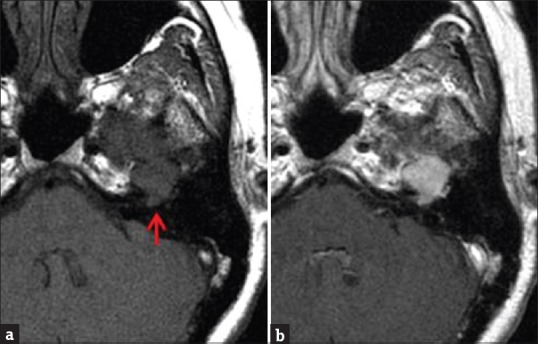
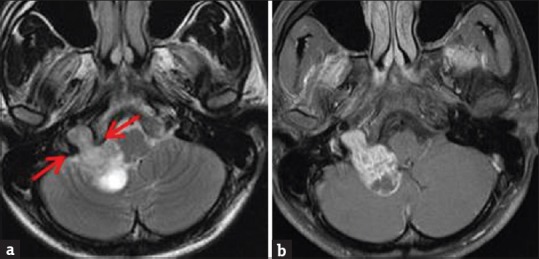
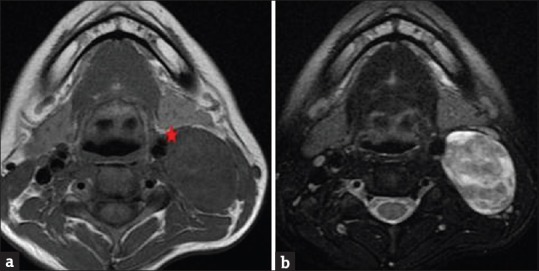
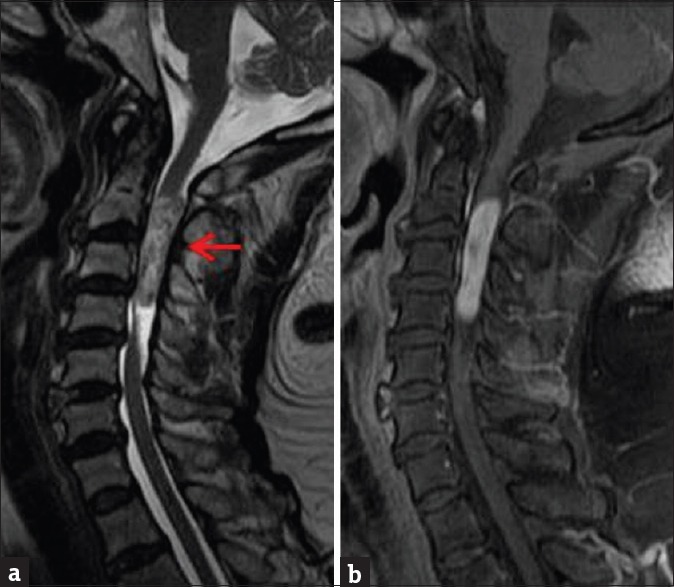
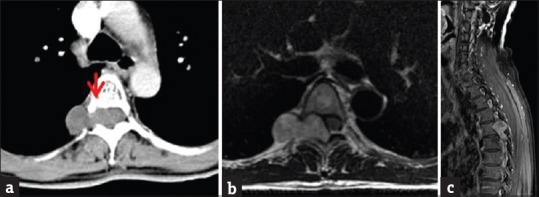
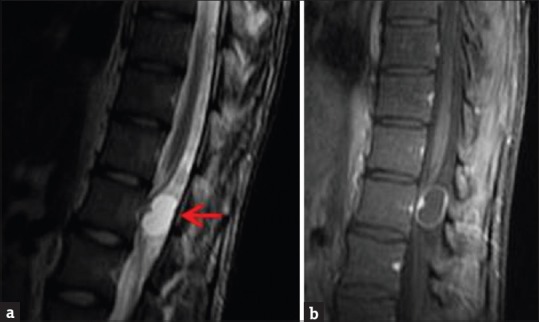
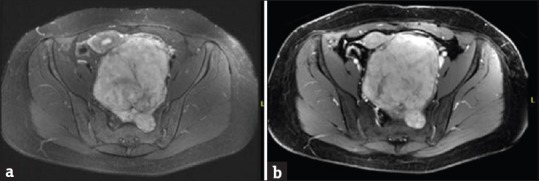
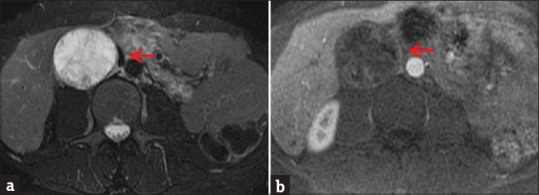
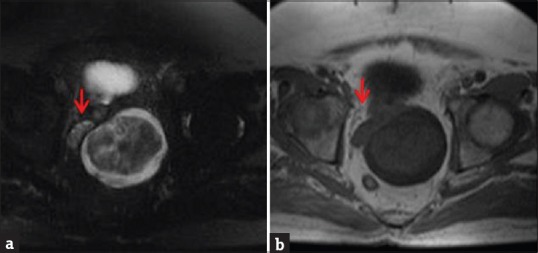
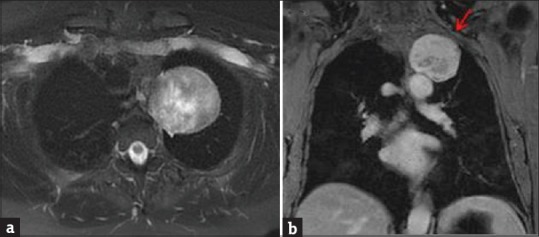
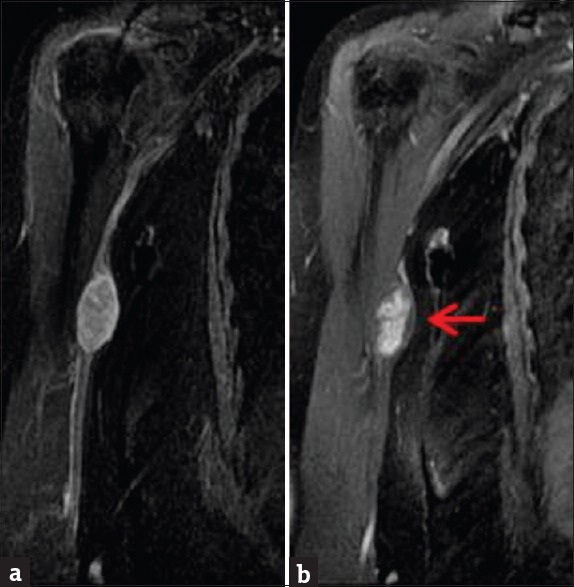
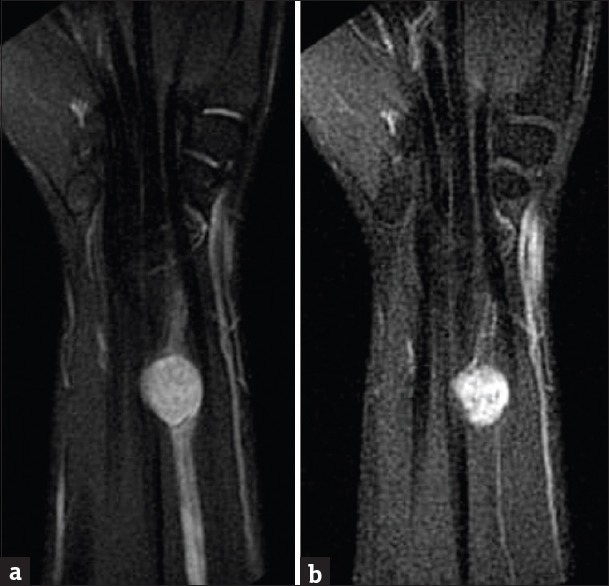
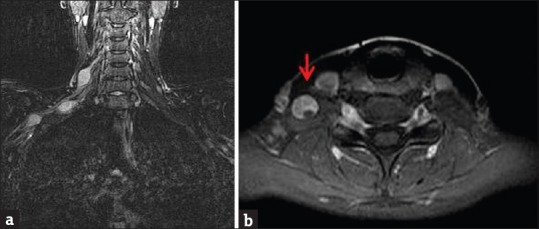
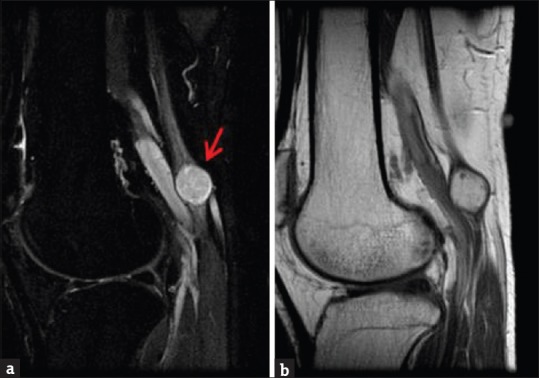
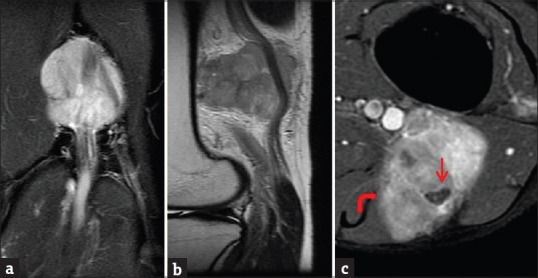
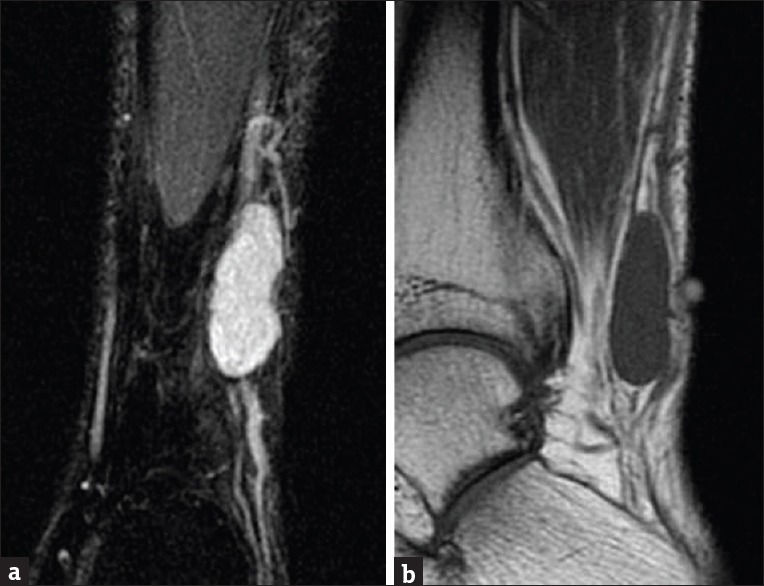
Schwannomas are benign soft-tissue tumors that arise from peripheral nerve sheaths throughout the body and are commonly encountered in patients with neurofibromatosis Type 2. The vast majority of schwannomas are benign, with rare cases of malignant transformation reported. In this pictorial review, we discuss the magnetic resonance imaging (MRI) appearance of schwannomas by demonstrating a collection of tumors from different parts of the body that exhibit similar MRI characteristics. We review strategies to distinguish schwannomas from malignant soft-tissue tumors while exploring the anatomic and histologic origins of these tumors to discuss how this correlates with their imaging findings. Familiarity with the MRI appearance of schwannomas can help aid in the differential diagnosis of soft-tissue masses, especially in unexpected locations.

Keywords: Magnetic resonance imaging; malignant peripheral nerve sheath tumor; peripheral nerve sheath tumor; schwannoma.


Conflict of interest statement

There are no conflicts of interest.

Figures

Figure 1
Figure 1
Contrast-enhanced brain magnetic resonance imaging in a patient with clinical diagnosis of neurofibromatosis Type 2. (a) Axial T2-weighted sequence demonstrates small bilateral isointense vestibular masses (arrows). (b) Enhanced T1-weighted sequence demonstrates enhancement of the masses. Right-sided mass is larger, causing mild expansion of the internal acoustic canal and an “ice-cream cone” appearance. Bilateral vestibular schwannomas are most commonly seen in patients with neurofibromatosis Type 2.
Figure 2
Figure 2
Contrast-enhanced brain magnetic resonance imaging. (a) Axial T2-weighted sequence demonstrates a right vestibular mass with high T2 signal correlating with areas of cystic degeneration (arrow). (b) Enhanced T1-weighted sequence demonstrates mild heterogeneous enhancement of the solid portions of the mass, with low T1 signal correlating with the cystic component (arrow).
Figure 3
Figure 3
Contrast-enhanced brain magnetic resonance imaging. (a) Axial T2-weighted sequence demonstrates large hyperintense left vestibular mass with extension into the internal auditory canal. Note a high T2 signal cerebrospinal fluid cleft laterally (arrow). (b) Enhanced T1-weighted sequence demonstrates heterogeneous mass enhancement.
Figure 4
Figure 4
Contrast-enhanced brain magnetic resonance imaging. (a) Unenhanced T1-weighted sequence demonstrates T1 isointense mass along the course of the infratemporal portion of the left facial nerve (arrow). (b) Enhanced axial T1-weighted sequence demonstrates fairly homogeneous mass enhancement.
Figure 5
Figure 5
Contrast-enhanced brain magnetic resonance imaging. (a) Axial T2-weighted sequence demonstrates iso-to-hyperintense dumbbell-shaped mass extending across the right jugular foramen (arrows) into the posterior cranial fossa. (b) Enhanced T1-weighted sequence demonstrates heterogeneous enhancement.
Figure 6
Figure 6
Magnetic resonance imaging of the neck without contrast. (a) Axial T1 sequence demonstrates large fusiform isointense mass within the left carotid sheath at level of the angle of the mandible. The mass displaces the carotid artery anteromedially (star). (b) Axial T2-weighted sequence demonstrates heterogeneous T2 signal, with areas of higher signal correlating with cystic degeneration.
Figure 7
Figure 7
Contrast-enhanced cervical spine magnetic resonance imaging. (a) Sagittal T2-weighted sequence demonstrates heterogeneously T2 hyperintense intramedullary mass extending from C2-C4 spinal segments. (b) Enhanced T1-weighted sequence demonstrates nearly homogeneous mass enhancement. Pathology was consistent with schwannoma.
Figure 8
Figure 8
Contrast-enhanced CT and magnetic resonance imaging of the thoracic spine. (a) Axial contrast-enhanced CT image demonstrating a classic dumbbell-shaped mass with the waist located at the right T5/T6 neural foramen. Note the scalloping of the posterior aspect of the vertebral body (arrow).(b) Axial T2-weighted sequence demonstrates similar findings with isointense T2 mass signal. (c) Sagittal enhanced T1-weighted magnetic resonance imaging demonstrates heterogeneous mass enhancement.
Figure 9
Figure 9
Contrast-enhanced magnetic resonance imaging of the lumbar spine. (a) Sagittal T2-weighted sequence demonstrates a small mass in the upper lumbar spine with primarily high T2 signal, consistent with cystic degeneration (arrow). (b) Enhanced T1-weighted sequence demonstrates mild enhancement of the noncystic portions of the mass.
Figure 10
Figure 10
Contrast-enhanced magnetic resonance imaging of the pelvis. (a). Axial T2-weighted fat-saturated sequence demonstrates hyperintense presacral mass arising from a left sacral foramen and extending into the pelvis causing mass effect.(b) Enhanced spoiled gradient-recalled sequence demonstrates intense heterogeneous mass enhancement. Pathology was consistent with schwannoma.
Figure 11
Figure 11
Contrast-enhanced magnetic resonance imaging of the abdomen. (a) Axial T2-weighted fat-saturated sequence demonstrates large, round primarily T2 hyperintense retroperitoneal mass (arrow). (b) Enhanced axial T1-weighted sequence demonstrates striations and peripheral rim-like enhancement (arrow). Lack of significant enhancement suggests cystic degeneration, which also correlates with the high T2 signal. Pathology consistent with schwannoma and also confirmed cystic degeneration.
Figure 12
Figure 12
Magnetic resonance imaging of the pelvis without contrast. (a) Axial T2-weighted fat-saturated sequence demonstrates nonspecific enlargement of the left seminal vesicle by a mass with both cystic (high T2) and solid (isointense T2) components. The normal right seminal vesicle can be seen for comparison (arrow). (b) Axial T1-weighted sequence low T1 signal of the mass.
Figure 13
Figure 13
Contrast-enhanced magnetic resonance imaging of the chest. (a) Axial T2-weighted fat-saturated sequence demonstrates well-circumscribed, heterogeneously T2 hyperintense, extrapulmonary mass in the left lung apex. (b) Coronal enhanced T1-weighted sequence demonstrates heterogeneous enhancement, with smooth remodeling of the left 2nd rib (arrow). At surgery, this mass was closely associated with an intercostal nerve. Pathology was consistent with schwannoma.
Figure 14
Figure 14
Contrast-enhanced magnetic resonance imaging of the right humerus. (a) Coronal enhanced T1-weighted sequence demonstrates a well-defined ovoid heterogeneously enhancing mass in the medial aspect of the right arm. (b) Short inversion time inversion recovery sequence demonstrates the same mass (arrow), eccentrically located in relation to the right ulnar nerve.
Figure 15
Figure 15
Contrast-enhanced magnetic resonance imaging of the right wrist. (a) Coronal T2-weighted sequence demonstrates round, T2 hyperintense mass just proximal to the wrist joint in close relation to the median nerve. (b) Enhanced T1-weighted images demonstrate nearly homogeneous mass enhancement.
Figure 16
Figure 16
Contrast-enhanced magnetic resonance imaging of the right brachial plexus. (a) Coronal short inversion time inversion recovery sequence demonstrates several T2 hyperintense ovoid schwannomas arising from the right brachial plexus. (b) Axial enhanced T1-weighted MR images demonstrate heterogeneous mass enhancement (arrow).
Figure 17
Figure 17
Contrast-enhanced magnetic resonance imaging of the right knee with attention to the popliteal fossa. (a) Sagittal short inversion time inversion recovery sequence demonstrates round T2 hyperintense mass closely associated with the tibial nerve (arrow). (b) Sagittal enhanced T1-weighted sequence demonstrates nearly homogeneous mass enhancement.
Figure 18
Figure 18
Contrast-enhanced magnetic resonance imaging of the left knee with attention to the popliteal fossa. (a) Coronal short inversion time inversion recovery sequence demonstrates large T2 hyperintense mass in the popliteal fossa. (b) Sagittal T1-weighted sequence demonstrates the T1 isointense mass closely related to the sciatic nerve. (c) Enhanced axial T1-weighted sequence demonstrates heterogeneous mass enhancement, with encasement of the sciatic nerve. Note the ill-defined medial margin (curved arrow); focal malignant degeneration was seen on histology.
Figure 19
Figure 19
Magnetic resonance imaging of the left ankle without contrast. (a) Coronal short inversion time inversion recovery sequence demonstrates well-defined T2 hyperintense fusiform mass at the lateral aspect of the ankle closely related to the sural nerve. (b) Sagittal T1-weighted sequence demonstrates isointense T1 signal of the mass.

References

    1. Murphey MD, Smith WS, Smith SE, Kransdorf MJ, Temple HT. From the archives of the AFIP. Imaging of musculoskeletal neurogenic tumors: Radiologic-pathologic correlation. Radiographics. 1999;19:1253–80. - PubMed
    1. Gomez-Brouchet A, Delisle MB, Cognard C, Bonafe A, Charlet JP, Deguine O, et al. Vestibular schwannomas: Correlations between magnetic resonance imaging and histopathologic appearance. Otol Neurotol. 2001;22:79–86. - PubMed
    1. Wippold FJ, 2nd, Lubner M, Perrin RJ, Lämmle M, Perry A. Neuropathology for the neuroradiologist: Antoni A and antoni B tissue patterns. AJNR Am J Neuroradiol. 2007;28:1633–8. - PMC - PubMed
    1. Moukarbel RV, Sabri AN. Current management of head and neck schwannomas. Curr Opin Otolaryngol Head Neck Surg. 2005;13:117–22. - PubMed
    1. Parmar HA, Ibrahim M, Castillo M, Mukherji SK. Pictorial essay: Diverse imaging features of spinal schwannomas. J Comput Assist Tomogr. 2007;31:329–34. - PubMed

LinkOut - more resources