. 2017 Apr 27;2(3):503-514.
doi: 10.1016/j.adro.2017.04.005. eCollection 2017 Jul-Sep.

Incorporating big data into treatment plan evaluation: Development of statistical DVH metrics and visualization dashboards

Affiliations

Incorporating big data into treatment plan evaluation: Development of statistical DVH metrics and visualization dashboards

Charles S Mayo et al. Adv Radiat Oncol. .

Abstract

Purpose: To develop statistical dose-volume histogram (DVH)-based metrics and a visualization method to quantify the comparison of treatment plans with historical experience and among different institutions.

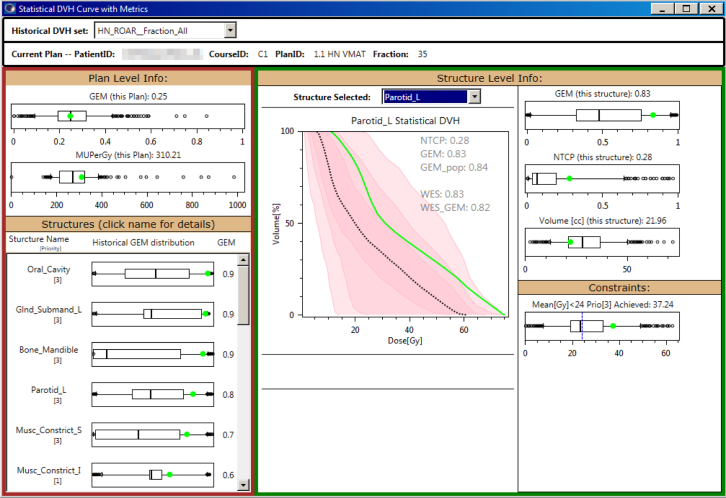
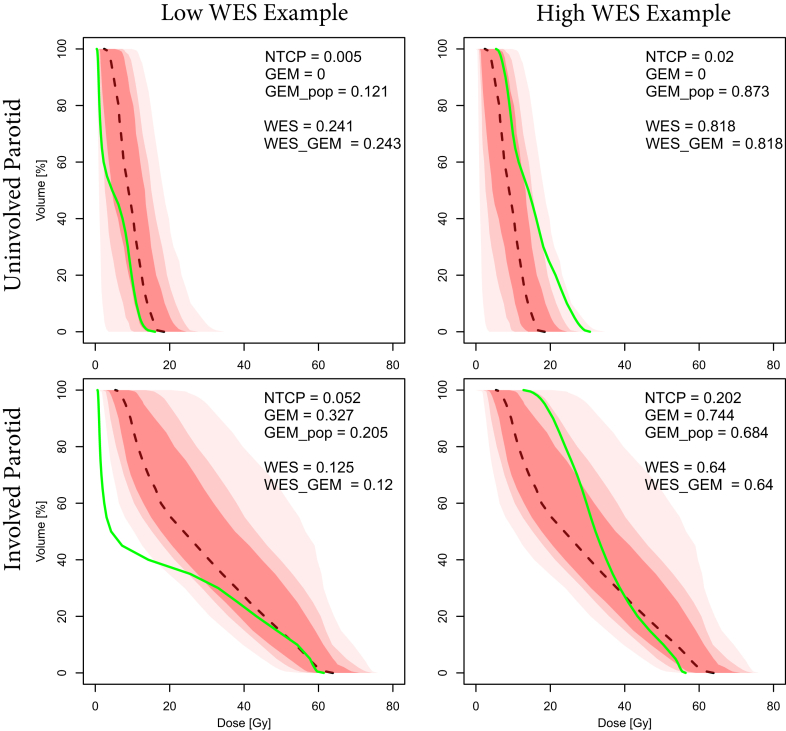
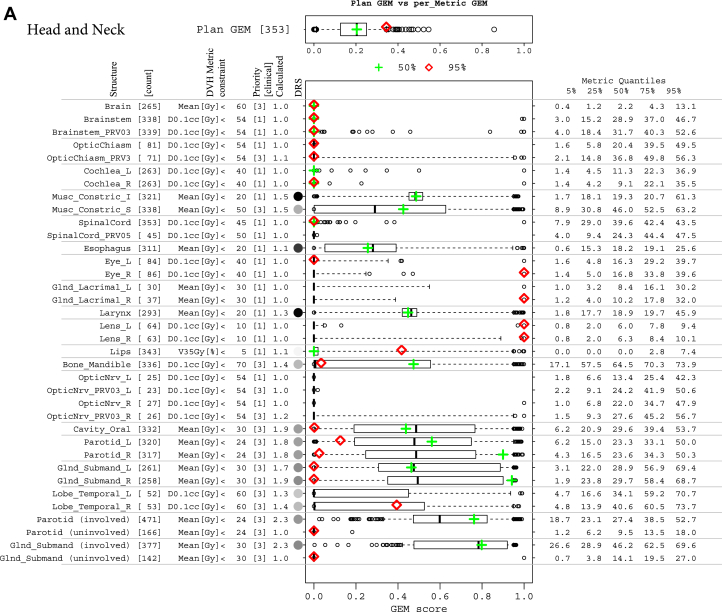
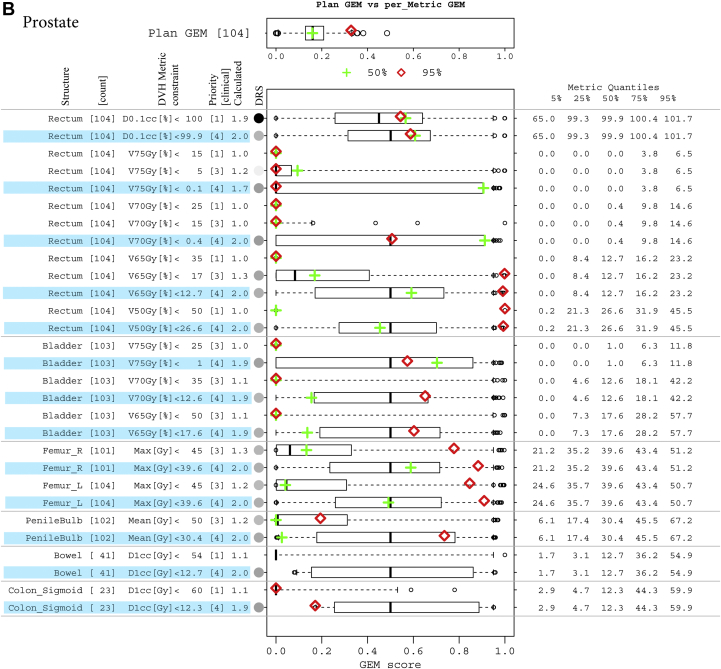
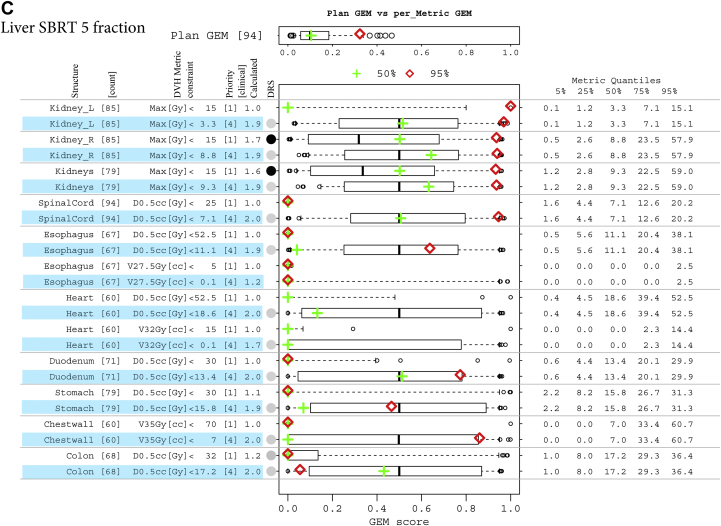
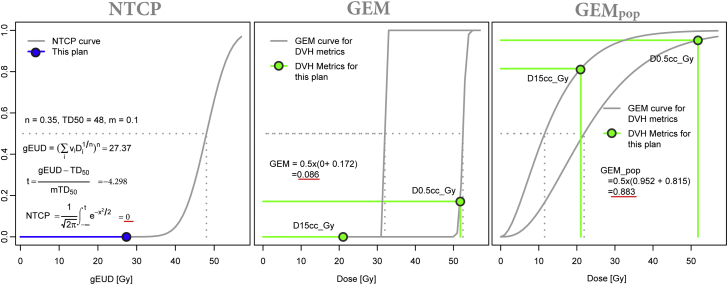
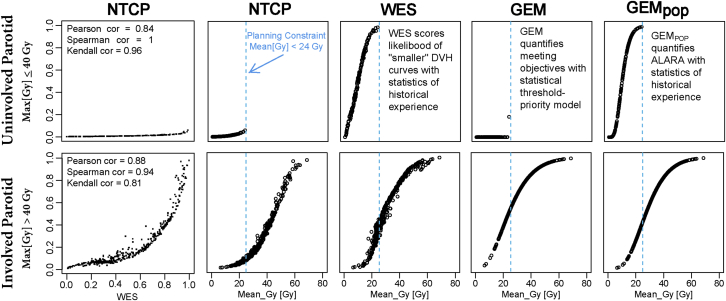
Methods and materials: The descriptive statistical summary (ie, median, first and third quartiles, and 95% confidence intervals) of volume-normalized DVH curve sets of past experiences was visualized through the creation of statistical DVH plots. Detailed distribution parameters were calculated and stored in JavaScript Object Notation files to facilitate management, including transfer and potential multi-institutional comparisons. In the treatment plan evaluation, structure DVH curves were scored against computed statistical DVHs and weighted experience scores (WESs). Individual, clinically used, DVH-based metrics were integrated into a generalized evaluation metric (GEM) as a priority-weighted sum of normalized incomplete gamma functions. Historical treatment plans for 351 patients with head and neck cancer, 104 with prostate cancer who were treated with conventional fractionation, and 94 with liver cancer who were treated with stereotactic body radiation therapy were analyzed to demonstrate the usage of statistical DVH, WES, and GEM in a plan evaluation. A shareable dashboard plugin was created to display statistical DVHs and integrate GEM and WES scores into a clinical plan evaluation within the treatment planning system. Benchmarking with normal tissue complication probability scores was carried out to compare the behavior of GEM and WES scores.

Results: DVH curves from historical treatment plans were characterized and presented, with difficult-to-spare structures (ie, frequently compromised organs at risk) identified. Quantitative evaluations by GEM and/or WES compared favorably with the normal tissue complication probability Lyman-Kutcher-Burman model, transforming a set of discrete threshold-priority limits into a continuous model reflecting physician objectives and historical experience.

Conclusions: Statistical DVH offers an easy-to-read, detailed, and comprehensive way to visualize the quantitative comparison with historical experiences and among institutions. WES and GEM metrics offer a flexible means of incorporating discrete threshold-prioritizations and historic context into a set of standardized scoring metrics. Together, they provide a practical approach for incorporating big data into clinical practice for treatment plan evaluations.


Figures

Figure 1
Figure 1
Statistical dose-volume histogram (DVH) dashboard quantifies comparison of statistical metrics for the current plan (green) versus historical experience. Statistical DVH (center) compares the DVH curve to historical experience for the median (dashed line), 50% confidence interval (CI; dark pink), 70% CI (intermediate pink), and 90% CI light pink. Box-and-whisker plots compare plan level (left panel) and structure level (right panel) metrics.
Figure 2
Figure 2
The use of the statistical dose-volume histogram (DVH) and metrics to compare DVH curves for patients with low and high weighted experience scores for uninvolved versus involved parotid.
Figure 3
Figure 3
(A) Decomposition and comparison of 2 plans from the head and neck cohort. Two plans of different difficulty levels, overall plan generalized evaluation metrics (GEM) at the median (green plus) and 95% quantile (red diamond), are detailed by GEM scores of each threshold-priority constraint (missing data indicate structure not contoured in that plan). Box-and-whisker plots have their whiskers located at the 5% and 95% quantiles of the GEM scores. Their corresponding metric values are tabled in the right columns of metric quantiles. (B) Decomposition and comparison of 2 plans from the prostate cohort, with as low as reasonably achievable (ALARA) constraints involved. ALARA thresholds (constraint values) are set to be the medians of their corresponding metric values, with an assigned priority of 4 and highlighted in blue. For the Rectum:V75Gy[%] constraint, which has a median of 0 Gy, a small number of 0.1 is used as the threshold. (C) Decomposition and comparison of 2 plans from 5-fraction liver stereotactic body radiation therapy cohort, with ALARA constraints involved. ALARA thresholds (constraint values) are set to be the medians of their corresponding metric values, with an assigned priority of 4 and highlighted in blue.
Figure 3
Figure 3
(A) Decomposition and comparison of 2 plans from the head and neck cohort. Two plans of different difficulty levels, overall plan generalized evaluation metrics (GEM) at the median (green plus) and 95% quantile (red diamond), are detailed by GEM scores of each threshold-priority constraint (missing data indicate structure not contoured in that plan). Box-and-whisker plots have their whiskers located at the 5% and 95% quantiles of the GEM scores. Their corresponding metric values are tabled in the right columns of metric quantiles. (B) Decomposition and comparison of 2 plans from the prostate cohort, with as low as reasonably achievable (ALARA) constraints involved. ALARA thresholds (constraint values) are set to be the medians of their corresponding metric values, with an assigned priority of 4 and highlighted in blue. For the Rectum:V75Gy[%] constraint, which has a median of 0 Gy, a small number of 0.1 is used as the threshold. (C) Decomposition and comparison of 2 plans from 5-fraction liver stereotactic body radiation therapy cohort, with ALARA constraints involved. ALARA thresholds (constraint values) are set to be the medians of their corresponding metric values, with an assigned priority of 4 and highlighted in blue.
Figure 4
Figure 4
Comparison of statistical metrics for heart doses in a liver stereotactic body radiation therapy (SBRT) patient treated with 5 fractions. Generalized evaluation metric (GEM) and GEMpop calculations use 2 priority 1 constraint values D15cc (Gy) and D0.5cc (Gy). These increase faster than normal tissue complication probability, consistent with more conservative clinical practice.
Figure 5
Figure 5
Comparison of normal tissue complication probability, weighted experience score, generalized evaluation metric (GEM), and GEMpop scores versus mean dose for involved and uninvolved parotids.

References

    1. Shirashi S., Moore K.L. Knowledge-based prediction of three-dimensional dose distributions for external beam radiotherapy. Med Phys. 2016;43:378–387. - PubMed
    1. Shiraishi S., Tan J., Olsen L.A., Moore K.L. Knowledge-based prediction of plan quality metrics in intracranial stereotactic radiosurgery. Med Phys. 2015;42:908–917. - PubMed
    1. Tol J.P., Dahele M., Delaney A.R., Slotman B.J. Verbakel WF Can knowledge-based DVH predictions be used for automated, individualized quality assurance of radiotherapy treatment plans? Radiat Oncol. 2015;10:234. - PMC - PubMed
    1. Wu B., Ricchetti F., Sanguineti G. Data-driven approach to generating achievable dose-volume histogram objectives in intensity-modulated radiotherapy planning. Int J Radiat Oncol Biol Phys. 2011;79:1241–1247. - PubMed
    1. Alfonso J.C., Herrero M.A., Nunez L. A dose-volume histogram based decision-support system for dosimetric comparison of radiotherapy plans. Radiat Oncol. 2015;10:263–271. - PMC - PubMed