. 2017 Nov 7;318(17):1668-1678.
doi: 10.1001/jama.2017.15927.

Factors Associated With Increases in US Health Care Spending, 1996-2013

Affiliations

Factors Associated With Increases in US Health Care Spending, 1996-2013

Joseph L Dieleman et al. JAMA. .

Abstract

Importance: Health care spending in the United States increased substantially from 1995 to 2015 and comprised 17.8% of the economy in 2015. Understanding the relationship between known factors and spending increases over time could inform policy efforts to contain future spending growth.

Objective: To quantify changes in spending associated with 5 fundamental factors related to health care spending in the United States: population size, population age structure, disease prevalence or incidence, service utilization, and service price and intensity.

Design and setting: Data on the 5 factors from 1996 through 2013 were extracted for 155 health conditions, 36 age and sex groups, and 6 types of care from the Global Burden of Disease 2015 study and the Institute for Health Metrics and Evaluation's US Disease Expenditure 2013 project. Decomposition analysis was performed to estimate the association between changes in these factors and changes in health care spending and to estimate the variability across health conditions and types of care.

Exposures: Change in population size, population aging, disease prevalence or incidence, service utilization, or service price and intensity.

Main outcomes and measures: Change in health care spending from 1996 through 2013.

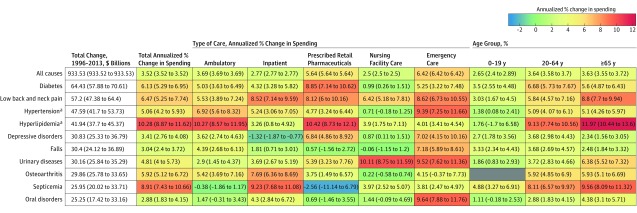
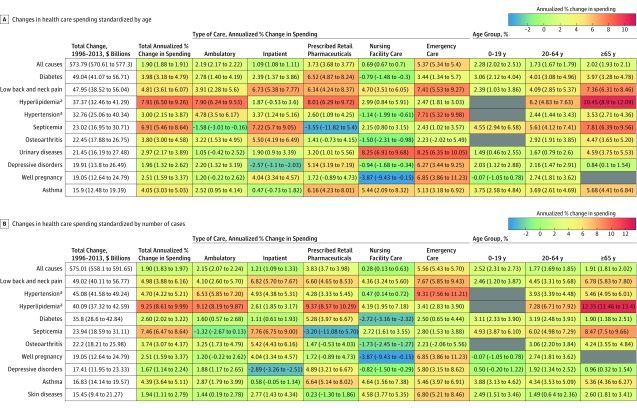
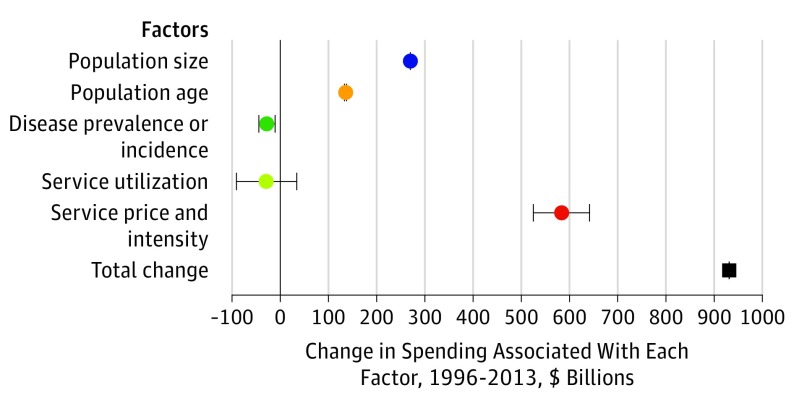
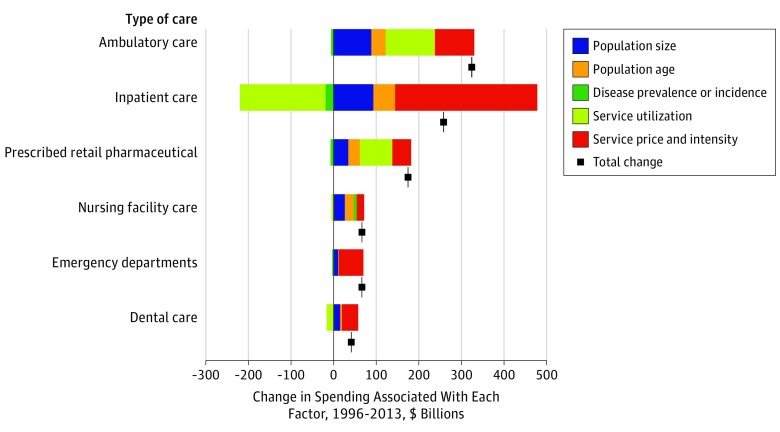
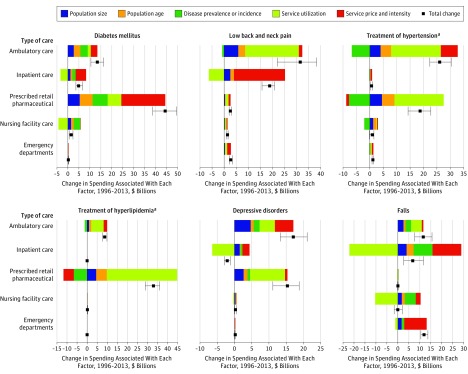
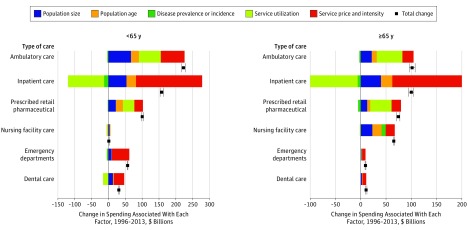
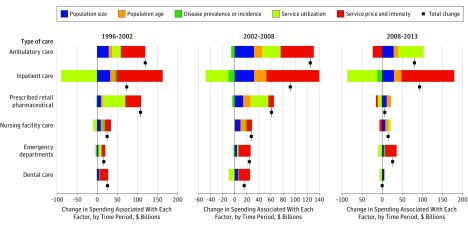
Results: After adjustments for price inflation, annual health care spending on inpatient, ambulatory, retail pharmaceutical, nursing facility, emergency department, and dental care increased by $933.5 billion between 1996 and 2013, from $1.2 trillion to $2.1 trillion. Increases in US population size were associated with a 23.1% (uncertainty interval [UI], 23.1%-23.1%), or $269.5 (UI, $269.0-$270.0) billion, spending increase; aging of the population was associated with an 11.6% (UI, 11.4%-11.8%), or $135.7 (UI, $133.3-$137.7) billion, spending increase. Changes in disease prevalence or incidence were associated with spending reductions of 2.4% (UI, 0.9%-3.8%), or $28.2 (UI, $10.5-$44.4) billion, whereas changes in service utilization were not associated with a statistically significant change in spending. Changes in service price and intensity were associated with a 50.0% (UI, 45.0%-55.0%), or $583.5 (UI, $525.2-$641.4) billion, spending increase. The influence of these 5 factors varied by health condition and type of care. For example, the increase in annual diabetes spending between 1996 and 2013 was $64.4 (UI, $57.9-$70.6) billion; $44.4 (UI, $38.7-$49.6) billion of this increase was pharmaceutical spending.

Conclusions and relevance: Increases in US health care spending from 1996 through 2013 were largely related to increases in health care service price and intensity but were also positively associated with population growth and aging and negatively associated with disease prevalence or incidence. Understanding these factors and their variability across health conditions and types of care may inform policy efforts to contain health care spending.


Conflict of interest statement

Conflict of Interest Disclosures: All authors have completed and submitted the ICMJE Form for Disclosure of Potential Conflicts of Interest and none were reported.

Figures

Figure 1.
Figure 1.. Changes in Spending and Annualized Percent Changes for the 10 Health Conditions With the Largest Absolute Spending Increases, 1996-2013
Spending amounts are reported and annualized percent changes in spending calculated using inflation-adjusted 2015 dollars. Values in parentheses indicate uncertainty intervals. Other neurologic disease actually had the fifth-largest increase in health care spending but was omitted from Figures 1 and 2 because it is a composite category made up of disparate neurologic diseases not included in the 6 other categories tracking spending on other neurologic diseases. Gray cell indicates values could not be calculated for that condition in that age group (no prevalence data). aSpending on treatment of this risk factor, rather than spending on diseases this risk factor causes.
Figure 2.
Figure 2.. Standardized Changes in Spending and Annualized Percent Changes for the 10 Health Conditions With the Largest Absolute Spending Increases, 1996-2013
Spending amounts are reported and annualized percent changes in spending calculated using inflation-adjusted 2015 dollars. Values in parentheses indicate uncertainty intervals. Top, Spending changes that would have occurred in the presence of a constant population size and structure. Bottom, Spending changes that would have occurred if age-specific disease prevalence rates remained constant. These spending changes exist because of changes in service utilization, price, and intensity. Gray cells indicate values could not be calculated for a condition in that age group (no prevalence data). aSpending on treatment of this risk factor, rather than spending on diseases this risk factor causes.
Figure 3.
Figure 3.. Changes in Annual Spending Associated With Each Factor in the 5-Factor Decomposition, 1996-2013
Data markers to the left of the black vertical line (no change) indicate factors associated with decreased spending; to the right of the line, factors associated with increased spending. Black square data marker indicates the total spending change between 1996 and 2013. Error bars indicate uncertainty intervals.
Figure 4.
Figure 4.. Changes in Annual Spending Associated With Each Factor in the 5-Factor Decomposition by Type of Care, 1996-2013
Each colored bar corresponds to 1 of 5 factors and reflects the amount of spending change associated with that factor. Bars to the left of the black vertical line (no change) indicate factors associated with decreased spending; to the right of the line, factors associated with increased spending within that type of care. The sum of the 5 bars equals the total spending change, 1996 through 2013, indicated with a black square marker. Error bars indicate uncertainty intervals.
Figure 5.
Figure 5.. Changes in Annual Spending Associated With Each Factor in the 5-Factor Decomposition by Type of Care for the 6 Conditions With the Largest Absolute Spending Increases, 1996-2013
Other neurologic diseases actually had the fifth-largest increase in health care spending but was omitted from this figure because it is a composite category made up of disparate neurologic diseases not included in the 6 other categories tracking spending on other neurologic diseases. The dental care category was omitted from the figure because none of the spending on these 6 health conditions is associated with dental care. Each colored bar corresponds to 1 of 5 factors and reflects the amount of spending change associated with that factor. Bars to the left of the black vertical line (no change) indicate factors associated with decreased spending; to the right of the line, factors associated with increased spending within that type of care. The sum of the 5 bars equals the total spending change, 1996 through 2013, indicated with a black square marker. Error bars indicate uncertainty intervals; absence of error bars around a marker indicates zero change. Condition-specific graphs for all health conditions included in this study are included in the eResults in the Supplement. aSpending on treatment of this risk factor, rather than spending on diseases this risk factor causes.
Figure 6.
Figure 6.. Spending Changes Associated With Each Factor in the 5-Factor Decomposition by Type of Care and Age Category, 1996-2013
Each colored bar corresponds to 1 of 5 factors and reflects the amount of spending change associated with that factor. Bars to the left of the black vertical line (no change) indicate factors associated with decreased spending; to the right of the line, factors associated with increased spending within that type of care. The sum of the 5 bars equals the total spending change, 1996 through 2013, indicated with a black square marker. Error bars indicate uncertainty intervals.
Figure 7.
Figure 7.. Spending Changes Associated With Each Factor in the 5-Factor Decomposition During 1996-2002, 2002-2008, and 2008-2013
Each colored bar corresponds to 1 of 5 factors and reflects the amount of spending change associated with that factor. Bars to the left of the black vertical line (no change) indicate factors associated with decreased spending; to the right of the line, factors associated with increased spending within that type of care. The sum of the 5 bars equals the total spending change for each period, indicated with the black square marker. Error bars indicate uncertainty intervals.

Comment in

References

    1. Centers for Medicare & Medicaid Services National health expenditure data. https://www.cms.gov/research-statistics-data-and-systems/statistics-tren.... Accessed February 1, 2017.
    1. Bureau of Economic Analysis National economic accounts. https://www.bea.gov/national/. 2017. Accessed March 8, 2017.
    1. Emanuel E, Tanden N, Altman S, et al. . A systemic approach to containing health care spending. N Engl J Med. 2012;367(10):949-954. - PubMed
    1. Dieleman JL, Baral R, Birger M, et al. . US spending on personal health care and public health, 1996-2013. JAMA. 2016;316(24):2627-2646. - PMC - PubMed
    1. Starr M, Dominiak L, Aizcorbe A. Decomposing growth in spending finds annual cost of treatment contributed most to spending growth, 1980-2006. Health Aff (Millwood). 2014;33(5):823-831. - PubMed