. 2018 Feb 1;103(2):236-249.
doi: 10.1113/EP086604. Epub 2017 Dec 7.

Hyperglycaemia induced by chronic i.p. and oral glucose loading leads to hypertension through increased Na+ retention in proximal tubule

Affiliations

Hyperglycaemia induced by chronic i.p. and oral glucose loading leads to hypertension through increased Na+ retention in proximal tubule

Selim Fakhruddin et al. Exp Physiol. .

Abstract

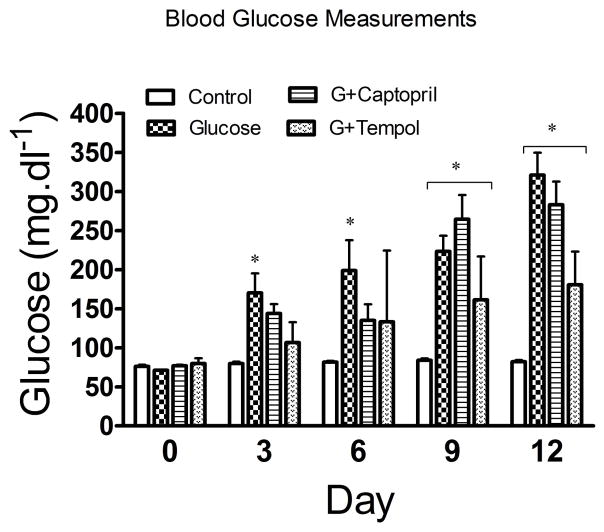
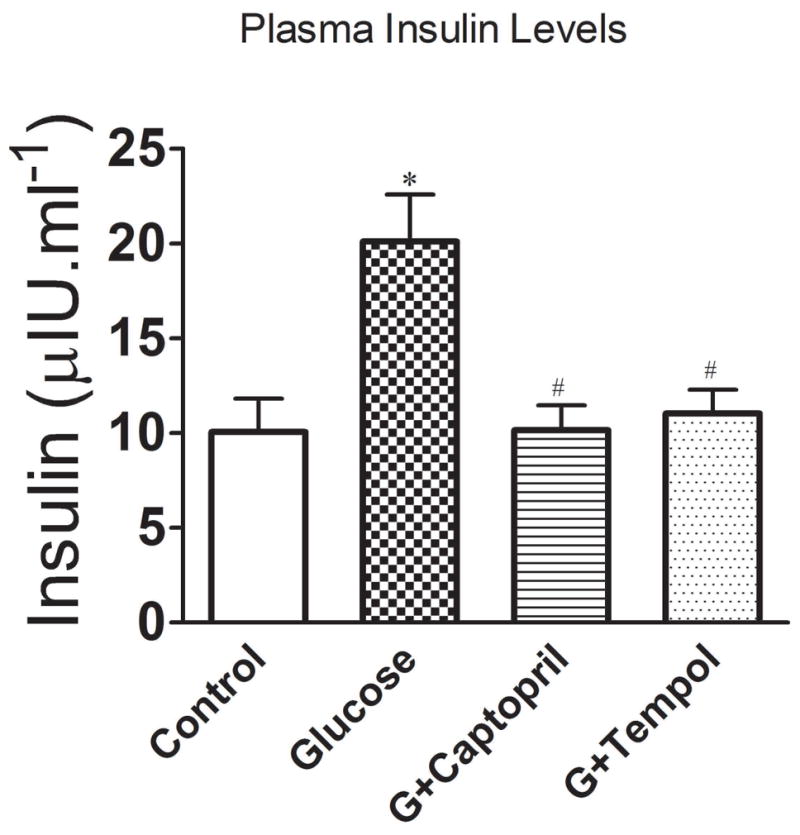
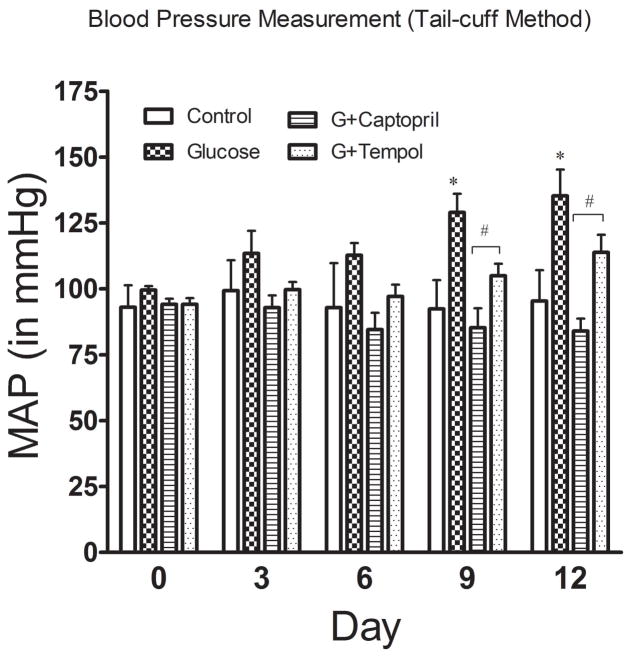
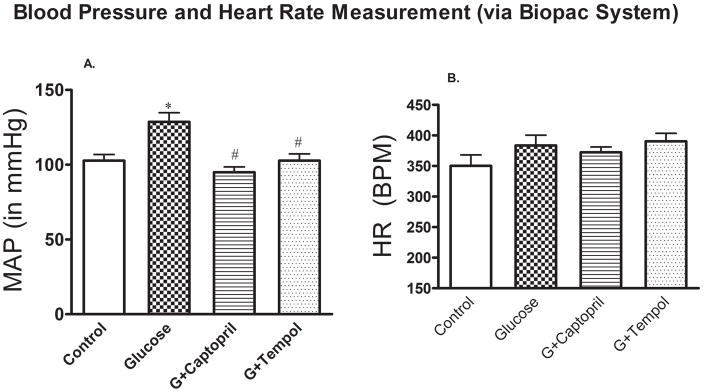
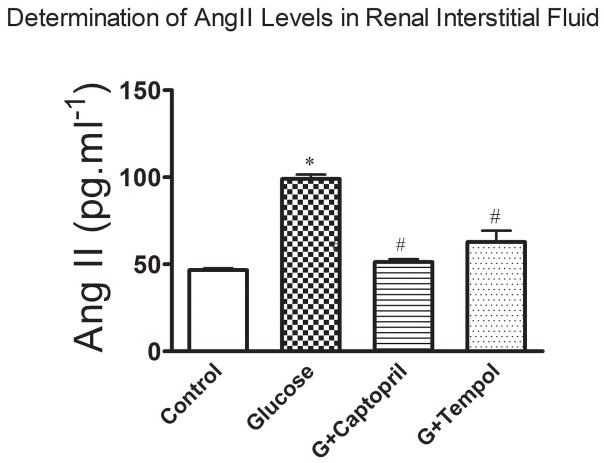
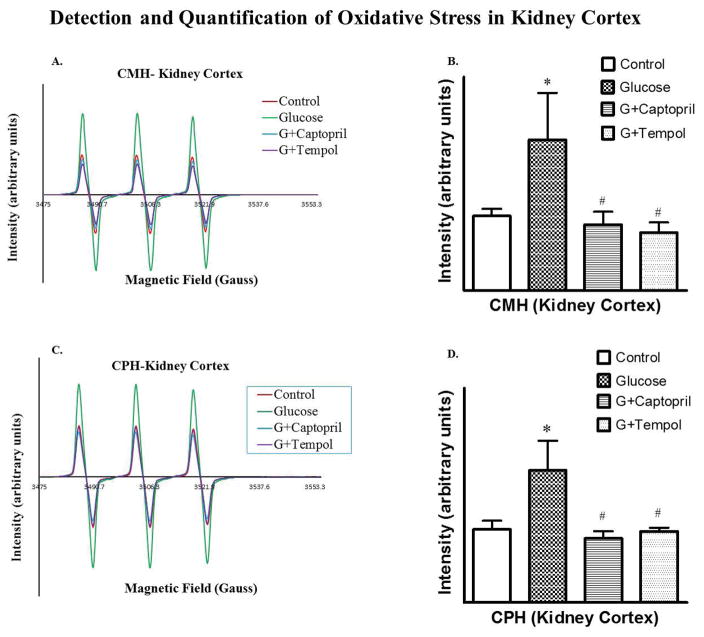
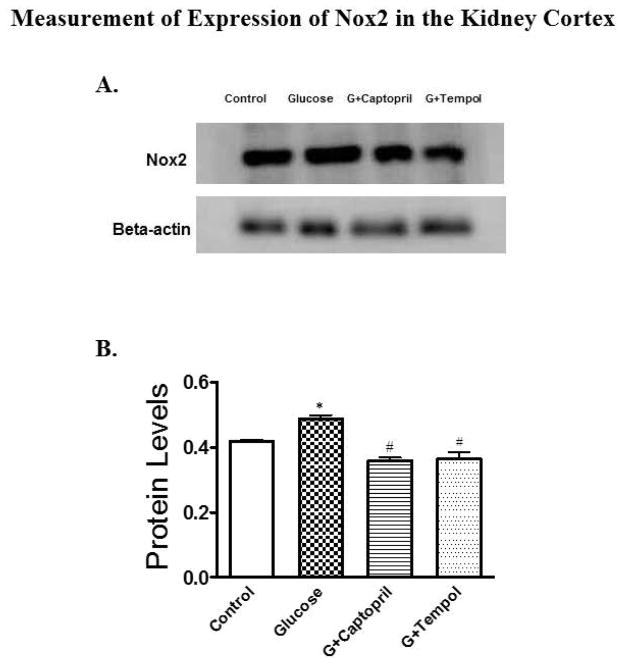
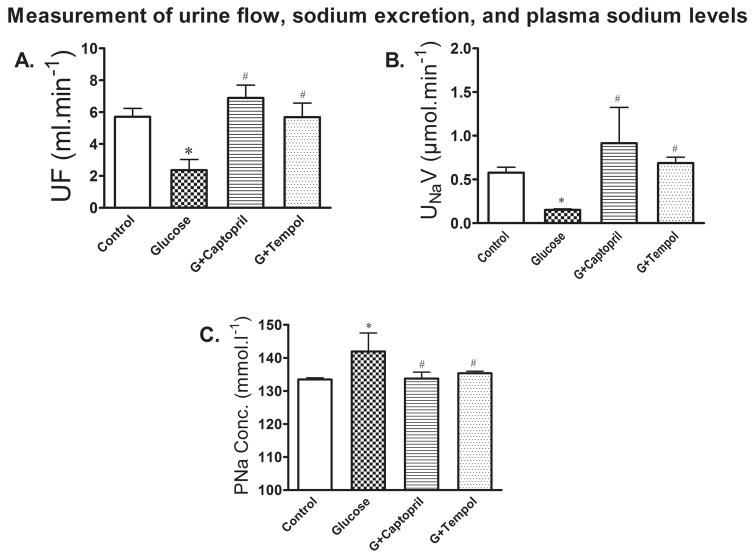
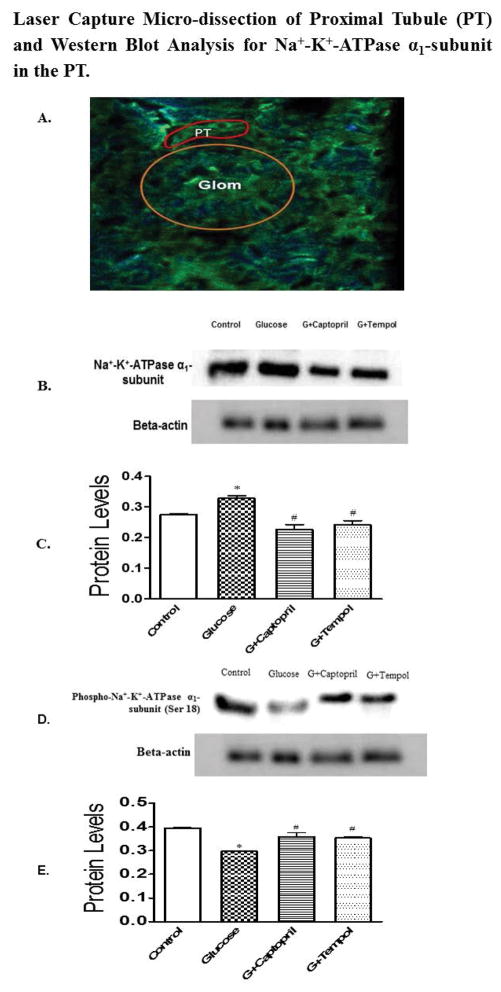
What is the central question of the study? Chronic glucose feeding accompanied by glucose injection (i.p.) causes sustained hyperglycaemia and hypertension in rats. The exact reason for the hypertension is not known. We explore some molecular pathways of the renal proximal tubule that might promote Na+ retention. What is the main finding and its importance? Development of hypertension was mediated by upregulation of the renal renin-angiotensin system and oxidative stress, acting via the Na+ -K+ -ATPase α1 -subunit in the proximal tubule, which appears to pump intracellular Na+ into the extracellular space, increasing Na+ reabsorption and blood pressure. Targeting the Na+ -K+ -ATPase α1 -subunit might provide a therapeutic strategy for treatment of hypertension. Feeding animals glucose-, fructose-, sucrose- and fat-enriched diets can lead to diet-induced hyperglycaemia, the severity of which largely depends on the types and concentrations of the nutrients used and duration of the dietary intervention. As a dietary intervention strategy, we adopted glucose-enriched diet and drinking water, with i.p. glucose injection at a dose previously determined to be effective to establish a sustained hyperglycaemia over a period of 2 weeks. We used four groups of Sprague-Dawley rats: control; glucose treated; glucose plus tempol treated; and glucose plus captopril treated. Blood glucose concentrations started to increase gradually from day 3, peaked (321 mg dl-1 ) at day 12 and remained at similar levels until the end of the study on day 14 in the glucose treated-group compared with the control group. In contrast, the tempol- and captopril-treated groups showed significantly high glucose concentrations only in the second week. The plasma insulin concentration was significantly increased in glucose-treated animals but not in tempol- and captopril-treated groups when compared with the control rats. We also observed elevated blood pressure in the glucose-treated group compared with the control group, which can be attributed to the increase in angiotensin II concentrations from 46.67 to 99 pg ml-1 (control versus glucose), increased oxidative stress in the cortical proximal tubule (PT), decreased urine flow, and increased expression and activity of the PT-specific α1 -subunit of Na+ -K+ -ATPase in the renal cortex, which is responsible for increased sodium reabsorption from epithelial cells of PT into the peritubular capillaries, leading to increased blood volume and eventual blood pressure. All these events were reversed in captopril- and tempol-treated animals.

Keywords: hyperglycemia; hypertension; renin-angiotensin system.


Conflict of interest statement

Competing interests

The authors declare no conflicts of interests

Figures

Fig. 1
Fig. 1
Measurement of blood glucose levels. Values are expressed as mean ± SD. *P <0.05 in the glucose, G+captopril, and G+tempol treated group when compared to the control group (Two-way ANOVA followed by Bonferroni tests)
Fig. 2
Fig. 2
Plasma insulin levels in control, glucose, G+captopril, and G+tempol treated groups. Values are expressed as mean ± SD. *P < 0.05 for the glucose vs control, #P <0.05 for glucose vs G+captopril, and G+tempol treated groups, respectively (One-way ANOVA followed by Tukey-Kramer multiple comparison).
Fig. 3
Fig. 3
Blood pressure measurement. Blood pressure was measured via tail cuff plethysmography for each of the groups (control, glucose, G+captopril, and G+tempol treated groups, n=6). Values are expressed as mean ± SD. *P <0.05, and #P <0.05 for the glucose vs control, and glucose vs G+captopril, G+tempol treated groups on day 0, day 3, day 6, day 9, and day 14 (Two-way ANOVA followed by Bonferroni posttests). When time factor was considered, the BP change was not significant at day 3 and 6 for all groups but captopril. However, BP change was significant in only day 6 for control vs glucose, and glucose vs G+tempol groups when tested individually using student’s t-test.
Fig 4
Fig 4
A. In-line mean arterial pressure (MAP) and B. heart rate (HR) measurement. Values are expressed as mean ± SD. *P < 0.05, and #P < 0.05 for the control vs glucose, and glucose vs G+captopril, G+tempol treated group, respectively (one-way ANOVA followed by Tukey-Kramer posttests). B. Heart rate: There was no significant difference in HR between all groups.
Fig 5
Fig 5
Angiotensin II was measured in the renal interstitial fluid sampled from the kidney cortex by commercially available Elisa kits. Values are expressed as mean ± SD. *P < 0.05, and #P < 0.05 for the control vs glucose, and glucose vs G+captopril, G+tempol treated groups, respectively (one-way ANOVA followed by Tukey-Kramer posttests).
Fig 6
Fig 6
Detection of superoxide (5A, B) and peroxynitrite (5C, D) to measure oxidative stress. 5A and 5B show EPR signal intensity, and relative EPR signal area (arbitrary units), respectively, for superoxide detection. 5C and 5D show EPR signal intensity, and relative EPR signal area (arbitrary units), respectively, for peroxynitrite detection. *P < 0.05, and #P < 0.05 for the control vs glucose, and glucose vs G+captopril, G+tempol treated group, respectively (one-way ANOVA followed by Tukey-Kramer posttests).
Fig 7
Fig 7
Western blot analysis for expression of Nox2 protein in the PT of kidney cortex. 6A and 6B present protein blot and quantified density of protein blots when normalized to β-actin for all groups. A significant increase in Nox2 expression was observed in the glucose-treated group as compared to control while expression was reduced significantly in G+captopril and G+tempol groups when compared to the glucose-treated group. *P < 0.05, and #P < 0.05 for the control vs glucose, and glucose vs G+captopril, G+tempol treated groups, respectively (one-way ANOVA followed by Tukey-Kramer posttests).
Fig 8
Fig 8
A. Urine flow (UF) was significantly decreased in the glucose-treated animals, but increased in G+captopril and G+tempol treated animals. B. In line with decreased urine flow, urinary sodium excretion (UNaV) was significantly decreased in the glucose-treated groups while sodium excretion is increased in the captopril and tempol treated groups. C. shows increased conservation of plasma sodium while it reduced plasma sodium concentration (PNa Conc.) in captopril and tempol treated animals. These observations together imply that increased sodium is retained in the kidney. Values are expressed as mean ± SD. *P < 0.05, and #P < 0.05 for the control vs glucose, and glucose vs G+captopril, G+tempol treated groups, respectively (one-way ANOVA followed by Tukey-Kramer posttests).
Fig 9
Fig 9
A. 10 μm thick tissue sections were cut in cryostat and mounted on PET-slides followed by serial staining as described in the protocol. The sections were observed under immunofluorescence-laser capture microscopy to catapult proximal tubule. The image (A) shows glomerulus (yellow circle) and PT (in red squiggle). B, D and C, E exhibit protein blot and quantified density of protein blots, respectively, from PT lysates when normalized to β-actin for all groups. A significant increase in Na+-K+-ATPase α1-subunit expression was observed in the glucose-treated group compared to control while expression was reduced significantly in G+captopril and G+tempol groups when compared to the glucose-treated group (B, C). Conversely, phosphorylated Na+-K+-ATPase α1-subunit (Ser 18) was attenuated in glucose group while captopril- and tempol treated animals showed significantly increased phosphorylation. The ratio of Na+-K+-ATPase α1-subunit expression to phosphorylated Na+-K+-ATPase α1-subunit was 0.69 in the Control, 1.1 in the glucose treated groups, 0.63 in the G+captopril treated group and 0.68 in the G+tempol treated group. *P < 0.05, and #P < 0.05 for the control vs glucose, and glucose vs G+captopril, G+tempol treated groups, respectively (one-way ANOVA followed by Tukey-Kramer posttests).

References

    1. Alanazi W, Fakhruddin S, Jackson KE. Microdialysis sampling of renal interstitial fluid in acute studies. International Journal of Biology. 2016;8:69–79.
    1. Banday AA, Lokhandwala MF. Loss of biphasic effect on Na/K-ATPase activity by angiotensin II involves defective angiotensin type 1 receptor-nitric oxide signaling. Hypertension. 2008;52:1099–1105. - PubMed
    1. Banday AA, Lokhandwala MF. Oxidative stress causes renal angiotensin II type 1 receptor upregulation, Na+/H+ exchanger 3 overstimulation, and hypertension. Hypertension. 2011;57:452–459. - PubMed
    1. Baum M. Insulin stimulates volume absorption in the Rabbit proximal convoluted tubule. J Clin Invest. 1987;79:1104–1109. - PMC - PubMed
    1. Brezniceanu ML, Liu F, Wei CC, Tran S, Schetelli S, Zhang SL, Guo DF, Filep JG, Ingelfinger JR, Chan JS. Catalase overexpression attenuates angiotensinogen expression and apoptosis in diabetic mice. Kidney Int. 2007;71:912–923. - PubMed