. 2018 Jan;17(1):970-978.
doi: 10.3892/mmr.2017.7997. Epub 2017 Nov 7.

Polygonum multiflorm alleviates glucocorticoid‑induced osteoporosis and Wnt signaling pathway

Affiliations

Polygonum multiflorm alleviates glucocorticoid‑induced osteoporosis and Wnt signaling pathway

Manru Zhou et al. Mol Med Rep. 2018 Jan.

Abstract

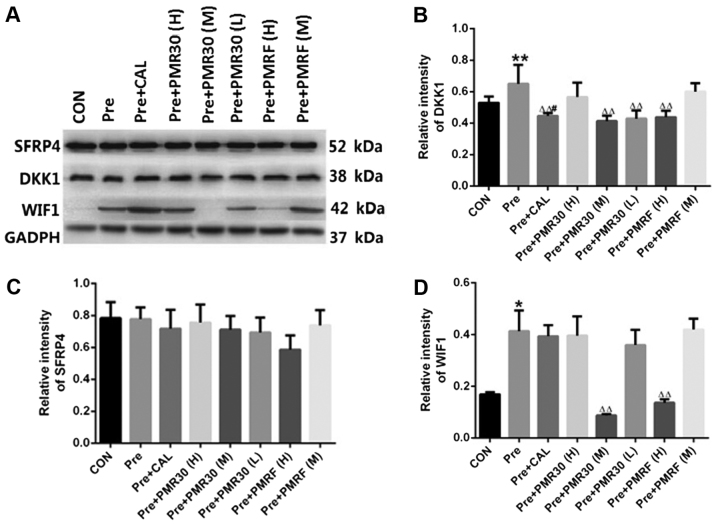
It is known that long‑term excessive administration of glucocorticoid (GC) results in osteoporosis. The present study aimed to evaluate the protective effects of Polygonum multiflorm (PM) on the bone tissue of rats with GC‑induced osteoporosis (GIO). A total of 90 6‑month‑old female Sprague Dawley rats (weight range, 190‑210 g) were randomly divided into nine groups: Control (normal saline); prednisone (GC; 6 mg·kg‑1·d‑1; Model); GC plus PMR30 (the 30% ethanol eluent fraction of PM) (H) (400 mg·kg‑1·d‑1); GC plus PMR30 (M) (200 mg·kg‑1·d‑1); GC plus PMR30 (L) (100 mg·kg‑1·d‑1); GC plus PMRF (fat‑soluble fraction of PM) (H) (400 mg·kg‑1·d‑1); GC plus PMRF (M) (200 mg·kg‑1·d‑1); GC plus PMRF (L) (100 mg·kg‑1·d‑1); GC plus calcitriol (CAL; 0.045 µg·kg‑1·d‑1; positive). Rats were administered intragastrically with prednisone and/or the aforementioned extracts for 120 days, and weighed once/week. The serum was collected for detection of biochemical markers. The left tibia was used for bone histomorphometry analysis. The right tibia was prepared for hematoxylin and eosin staining. The left femur was used to analyze the protein expression of dickkopf‑1 (DKK1), WNT inhibitory factor 1 (WIF1) and secreted frizzled related protein 4 using western blotting. Long‑term excessive treatment of prednisone inhibited the bone formation rate accompanied with a decrease in bone mass, growth plate, body weight, and the level of bone‑specific alkaline phosphatase and hydroxyl‑terminal propeptide of type I procollagen in the serum. Furthermore, a simultaneously increase in the level of tartrate resistant acid phosphatase‑5b and cross‑linked carboxy‑terminal telopeptide of type I collagen in the serum, in addition to DKK1, and WIF1 protein expression, was observed. PMR30 (M and L) and PMRF (H) groups were able to reduce the negative effects of GC on the bones. PMR30 (M and L) and PMRF (H) dose demonstrated a protective effect of PM on bone tissue in GIO rats. The mechanism underlying the preventive effect of PM for the treatment of GIO may be associated with direct upregulation of the canonical Wnt/β‑catenin signaling pathway.


Figures

Figure 1.
Figure 1.
Body weight (g) changes during the experimental period. Body weight measurements from vehicle-treated controls (CON), prednisone 6 mg.kg−1.d−1 (Pre), calcitriol 0.045 µg.kg−1.d−1 (CAL), PMR30 (H) 400 mg.kg−1.d−1, PMR30 (M) 200 mg.kg−1.d−1, PMR30 (L) 100 mg.kg−1.d−1, PMRF (H) 400 mg.kg−1.d−1, PMRF (M) 200 mg.kg−1.d−1, and PMRF (L) 100 mg.kg−1.d−1 treated rats. aP<0.05 vs CON, dP<0.05 PMR30 (M) vs. Pre, fP<0.05 PMRF (H) vs. Pre.
Figure 2.
Figure 2.
Endpoint levels of serum biochemical markers (A) CTX-I, (B) DKK1, (C) TRACP-5b, (D) BAP, (E) PICP in the rats treated with vehicle (CON), prednisone (Pre), calcitriol (CAL), and various PMR (30, F) dose levels. *P<0.05, **P<0.01 vs. CON; P<0.05, ∆∆P<0.01 vs. Pred; #P<0.05, ##P<0.01 vs. CAL.
Figure 3.
Figure 3.
Effects of vehicle (CON), prednisone (Pre), calcitriol (CAL), and various PMR (30, F) dose treatments on the proximal tibial metaphysis (PTM) bone structure and mineral bone formation. Arrows point to the tetracycline and calcein labeling. Quantitative measurements of histomorphometric parameters of PTM are showed in Tables II and III. (A) Goldner's Trichrome stain, (B) AgNO3 stain,(C) fluorescence images of undecalcified sections a-1, b-1, c-1:CON; a-2, b-2, c-2:Pre (6 mg.−1.d−1); a-3, b-3, c-3:Pre+CAL (0.045 µg.kg−1.d−1); a-4, b-4, c-4:Pre+PMR30 (H) (400 mg.kg−1.d−1); a-5, b-5, c-5:Pre+PMR30 (M) (200 mg.kg−1.d−1); a-6, b-6, c-6:Pre+PMR30 (L) (100 mg.kg−1.d−1); a-7, b-7, c-7:Pre+PMRF (H) (400 mg.kg−1.d−1); a-8, b-8.c-8:Pre+PMRF (M) (200 mg.kg−1.d−1); a-9, b-9, c-9: Pre+PMRF (L) (100 mg.kg−1.d−1).
Figure 4.
Figure 4.
Effects of vehicle (CON) and various prednisone (Pre) dose treatments on cortical bone of the tibial shaft and cartilage growth. Arrows point to interlabeling distances after double labeling with tetracycline and calcein. Quantitative measurements of histomorphometric parameters of tibial shaft are shown in Tables V and VI. (A) Fluorescence images of the tibial shaftmiddle and (B) fluorescence images of the growth plate
Figure 5.
Figure 5.
Effects of vehicle-treated controls (CON), prednisone 6 mg.kg−1.d−1 (Pred), calcitriol 0.045 µg.kg−1.d−1 (CAL), and variuos PMR (30, F) dose treatments on adipocyte distribution in bone marrow of PTM. (A) CON; (B) Pre (6 mg.−1kg−1.d−1); (C) Pre+CAL (0.045 µg.kg−1.d−1); (D) Pre+PMR30 (H) (400 mg.kg−1.d−1); (E) Pre+PMR30 (M) (200 mg.kg−1.d−1); (F) Pre+PMR30 (L) (100 mg.kg−1.d−1); (G) Pre+PMRF (H) (400 mg.kg−1.d−1); (H) Pre+PMRF (M) (200 mg.kg−1.d−1); (I) Pre+PMRF (L) (100 mg.kg−1.d−1).
Figure 6.
Figure 6.
Effects of the extracts of PM on target protein of wnt signaling pathways in GIO rats. (A) The scanned image on X-rays was after exposure of western blot analysis. (B) The DKK1 protein of wnt signaling pathways in GIO rats. (C) The SFRP4 protein of wnt signaling pathways in GIO rats. (D) The WIF1 protein of wnt signaling pathways in GIO rats. *P<0.05, **P<0.01 vs. CON; P<0.05, ∆∆P<0.01 vs. Pred; #P<0.05, ##P<0.01 vs. CAL.

Similar articles

Cited by

References

    1. McLaughlin F, Mackintosh J, Hayes BP, McLaren A, Uings IJ, Salmon P, Humphreys J, Meldrum E, Farrow SN. Glucocorticoid-induced osteopenia in the mouse as assessed by histomorphometry, microcomputed tomography, and biochemical markers. Bone. 2002;30:924–930. doi: 10.1016/S8756-3282(02)00737-8. - DOI - PubMed
    1. Ogoshi T, Hagino H, Fukata S, Tanishima S, Okano T, Teshima R. Influence of glucocorticoid on bone in 3-, 6- and 12-month-old rats as determined by bone mass and histomorphometry. Mod Rheumatol. 2008;18:552–561. doi: 10.3109/s10165-008-0096-2. - DOI - PubMed
    1. Buttgereit F, Burmester GR, Lipworth BJ. Optimised glucocorticoid therapy: The sharpening of an old spear. Lancet. 2005;365:801–803. doi: 10.1016/S0140-6736(05)71005-9. - DOI - PubMed
    1. den Uyl D, Bultink IE, Lems WF. Advances in glucocorticoid-induced osteoporosis. Curr Rheumatol Rep. 2011;13:233–240. doi: 10.1007/s11926-011-0173-y. - DOI - PMC - PubMed
    1. Schäcke H, Döcke WD, Asadullah K. Mechanisms involved in the side effects of glucocorticoids. Pharmacol Ther. 2002;96:23–43. doi: 10.1016/S0163-7258(02)00297-8. - DOI - PubMed