

Analyses of methylomes of upland and lowland switchgrass (Panicum virgatum) ecotypes using MeDIP-seq and BS-seq
- PMID: 29115936
- PMCID: PMC5678558
- DOI: 10.1186/s12864-017-4218-0
Analyses of methylomes of upland and lowland switchgrass (Panicum virgatum) ecotypes using MeDIP-seq and BS-seq
Abstract
Background: Switchgrass is a crop with many desirable traits for bioenergy production. Plant genomes have high DNA methylation levels throughout genes and transposable elements and DNA methylation is known to play a role in silencing transposable elements. Here we analyzed methylomes in two switchgrass genotypes AP13 and VS16. AP13 is derived from a lowland ecotype and VS16, typically considered drought-tolerant, is derived from an upland ecotype, both genotypes are tetraploid (2n = 4× = 36).
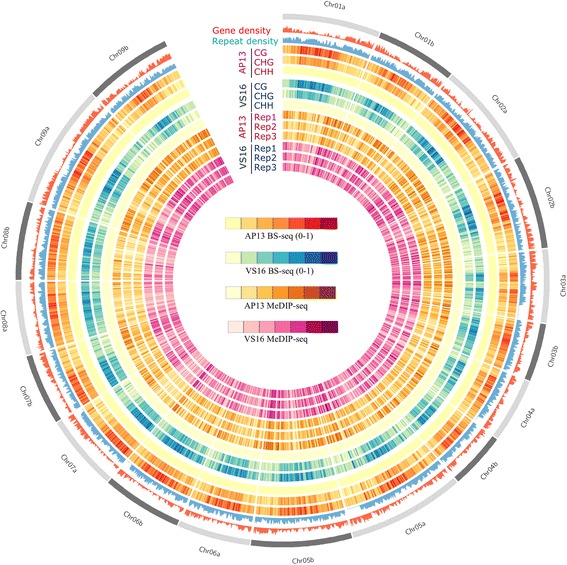
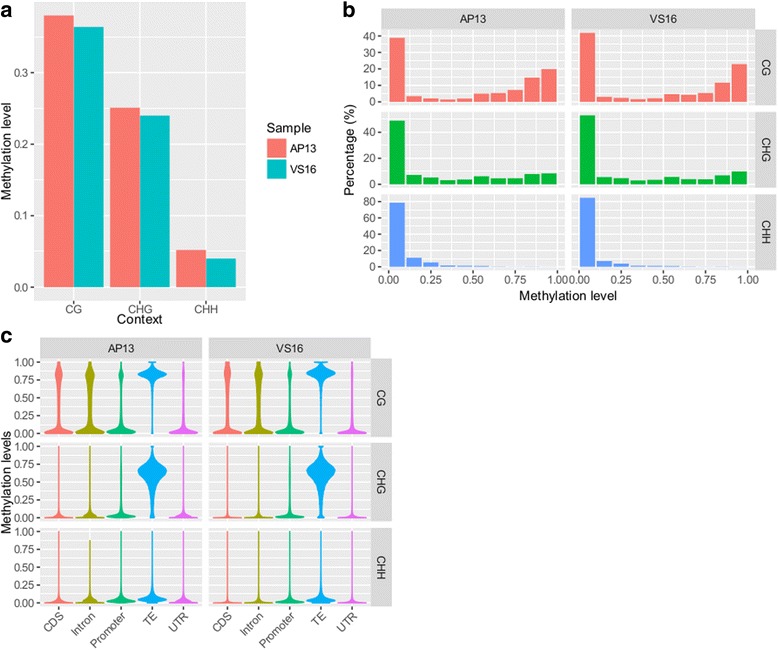
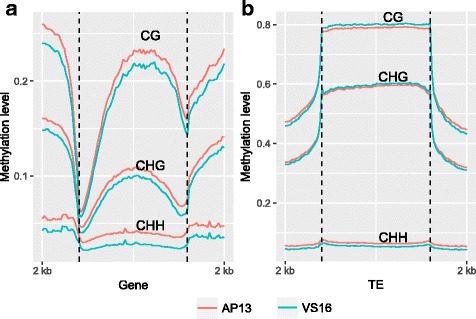
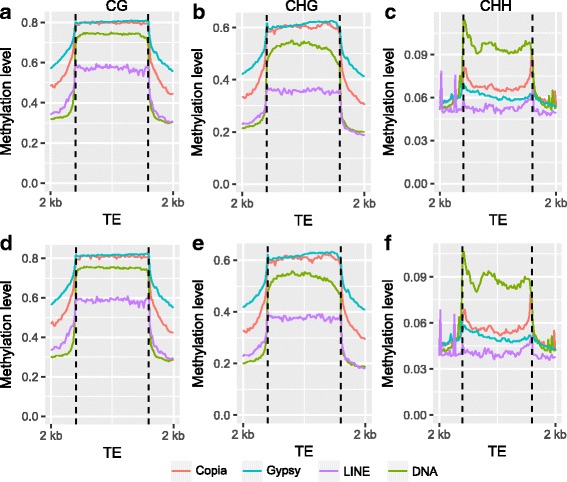
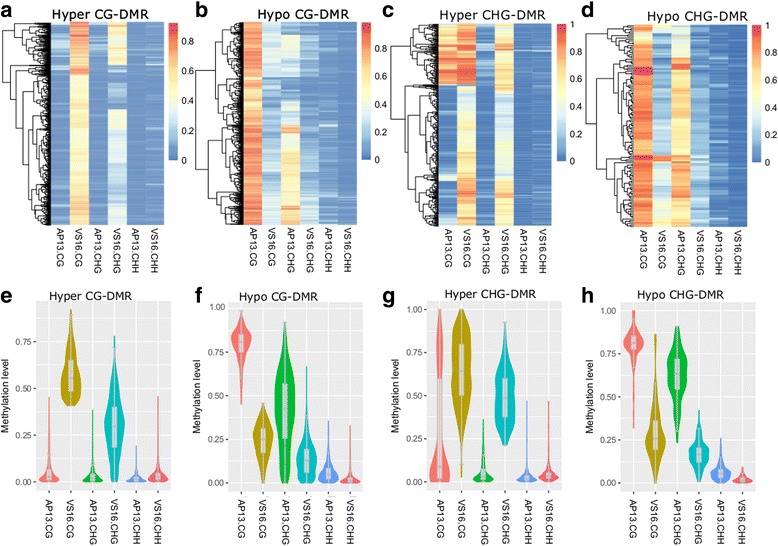
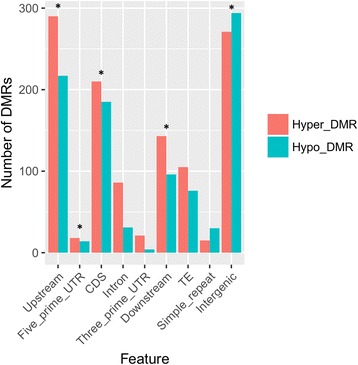
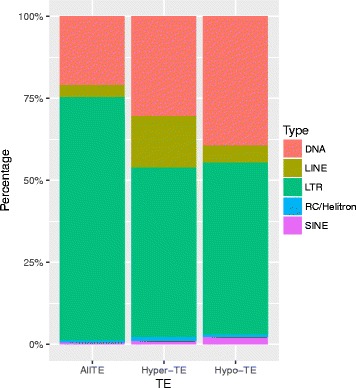
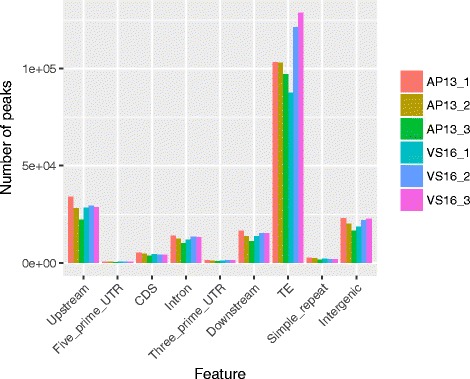
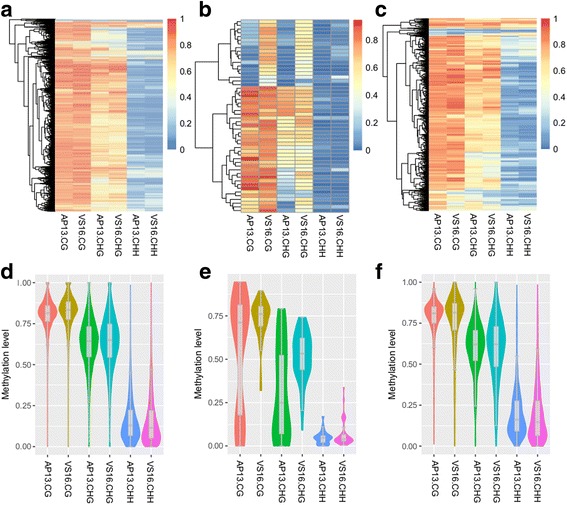
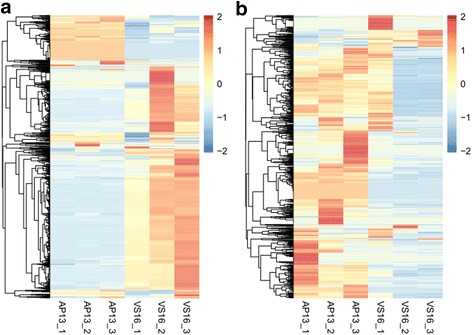
Results: Methylated DNA immunoprecipitation-sequencing (MeDIP-seq) and bisulfite-sequencing (BS-seq) were used to profile DNA methylation in genomic features of AP13 and VS16. The methylation patterns in genes and transposable elements were similar to other plants, however, overall CHH methylation levels were comparatively low. Differentially methylated regions (DMRs) were assessed and a total of 1777 CG-DMRs, 573 CHG-DMRs, and 3 CHH-DMRs were detected between the two genotypes. TEs and their flanking regions were higher than that of genic regions. Different types of TEs had different methylation patterns, but the two LTRs (Copia and Gypsy) were similarly methylated, while LINEs and DNA transposons typically had different methylation patterns. MeDIP-seq data was compared to BS-seq data and most of the peaks generated by MeDIP-seq were confirmed to be highly methylated by BS-seq.
Conclusions: DNA methylation in switchgrass genotypes obtained from the two ecotypes were found similar. Collinear gene pairs in two subgenomes (A and B) were not significantly differentially methylated. Both BS-seq and MeDIP-seq methodologies were found effective. Methylation levels were highest at CG and least in CHH. Increased DNA methylation was seen in TEs compared to genic regions. Exploitation of TE methylations can be a viable option in future crop improvement.
Keywords: MeDIP-Seq; Methylome; Panicum virgatum; Switchgrass; Whole genome bisulfite-sequencing.
Conflict of interest statement
Ethics approval and consent to participate
Ethics approval was not needed for this study.
Consent for publication
Not applicable.
Competing interests
The authors declare that they have no competing interests.
Publisher’s Note
Springer Nature remains neutral with regard to jurisdictional claims in published maps and institutional affiliations.
Figures
Similar articles
-
Genome-wide identification of histone methylation (H3K9me2) and acetylation (H4K12ac) marks in two ecotypes of switchgrass (Panicum virgatum L.).BMC Genomics. 2019 Aug 22;20(1):667. doi: 10.1186/s12864-019-6038-x. BMC Genomics. 2019. PMID: 31438854 Free PMC article.
-
Comparative transcriptome profiling of upland (VS16) and lowland (AP13) ecotypes of switchgrass.Plant Cell Rep. 2017 Jan;36(1):129-150. doi: 10.1007/s00299-016-2065-0. Epub 2016 Nov 3. Plant Cell Rep. 2017. PMID: 27812750 Free PMC article.
-
DISMISS: detection of stranded methylation in MeDIP-Seq data.BMC Bioinformatics. 2016 Jul 29;17(1):295. doi: 10.1186/s12859-016-1158-7. BMC Bioinformatics. 2016. PMID: 27473283 Free PMC article.
-
Dynamic DNA Methylation in Plant Growth and Development.Int J Mol Sci. 2018 Jul 23;19(7):2144. doi: 10.3390/ijms19072144. Int J Mol Sci. 2018. PMID: 30041459 Free PMC article. Review.
-
DNA methylation profile: a composer-, conductor-, and player-orchestrated Mammalian genome consisting of genes and transposable genetic elements.J Reprod Dev. 2012;58(3):265-73. doi: 10.1262/jrd.2011-030. J Reprod Dev. 2012. PMID: 22790869 Review.
Cited by
-
Genome-wide identification of histone methylation (H3K9me2) and acetylation (H4K12ac) marks in two ecotypes of switchgrass (Panicum virgatum L.).BMC Genomics. 2019 Aug 22;20(1):667. doi: 10.1186/s12864-019-6038-x. BMC Genomics. 2019. PMID: 31438854 Free PMC article.
-
Aphid-Responsive Defense Networks in Hybrid Switchgrass.Front Plant Sci. 2020 Jul 30;11:1145. doi: 10.3389/fpls.2020.01145. eCollection 2020. Front Plant Sci. 2020. PMID: 32849703 Free PMC article.
-
siRNAs regulate DNA methylation and interfere with gene and lncRNA expression in the heterozygous polyploid switchgrass.Biotechnol Biofuels. 2018 Jul 24;11:208. doi: 10.1186/s13068-018-1202-0. eCollection 2018. Biotechnol Biofuels. 2018. PMID: 30061930 Free PMC article.
-
Plant DNA Methylation Responds to Nutrient Stress.Genes (Basel). 2022 May 31;13(6):992. doi: 10.3390/genes13060992. Genes (Basel). 2022. PMID: 35741754 Free PMC article. Review.
References
-
- Wright L. Historical perspective on how and why switchgrass was selected as a ‘model’ high-potential energy crop. Consultancy Work to Bioenergy Resources and Engineering Systems, ORNL/TM-2007/109. 2007:1–59.
-
- Brown C, Griggs T, Keene T, et al. Switchgrass biofuel production on reclaimed surface mines: I. Soil quality and dry matter yield. BioEnergy Res. 2016;9:31–39. doi: 10.1007/s12155-015-9658-2. - DOI
-
- Williams T, Auer C. Ploidy number for Panicum Virgatum (switchgrass) from the Long Island sound coastal lowland compared to upland and lowland cultivars. Plant Sci Artic. 2014:1–14.
-
- Zhang Y, Zalapa J, Jakubowski AR, et al. Natural hybrids and gene flow between upland and lowland switchgrass. Crop Sci. 2011;51:2626–2641. doi: 10.2135/cropsci2011.02.0104. - DOI
MeSH terms
LinkOut - more resources
Full Text Sources
Other Literature Sources
