. 2017 Nov 7;8(1):250.
doi: 10.1186/s13287-017-0701-4.

Single cell transcriptomics suggest that human adipocyte progenitor cells constitute a homogeneous cell population

Affiliations

Single cell transcriptomics suggest that human adipocyte progenitor cells constitute a homogeneous cell population

Juan R Acosta et al. Stem Cell Res Ther. .

Abstract

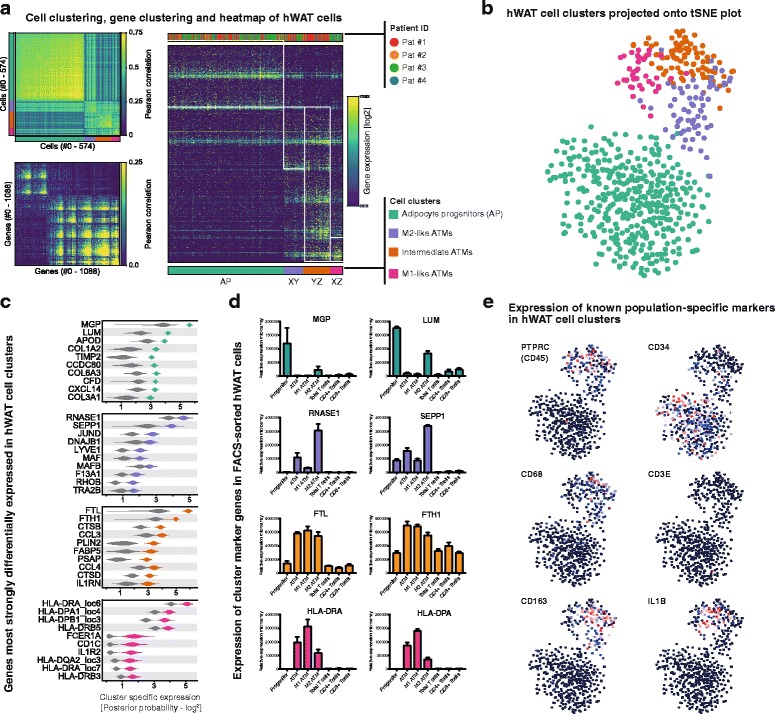
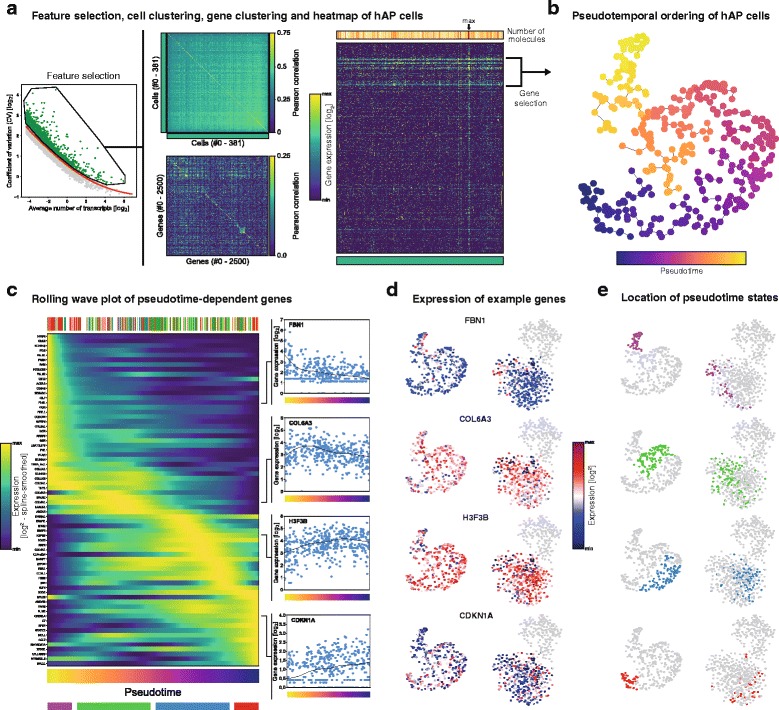
Regulation of adipose tissue stem cells (ASCs) and adipogenesis impact the development of excess body fat-related metabolic complications. Animal studies have suggested the presence of distinct subtypes of ASCs with different differentiation properties. In addition, ASCs are becoming the biggest source of mesenchymal stem cells used in therapies, which requires deep characterization. Using unbiased single cell transcriptomics we aimed to characterize ASC populations in human subcutaneous white adipose tissue (scWAT). The transcriptomes of 574 single cells from the WAT total stroma vascular fraction (SVF) of four healthy women were analyzed by clustering and t-distributed stochastic neighbor embedding visualization. The identified cell populations were then mapped to cell types present in WAT using data from gene expression microarray profiling of flow cytometry-sorted SVF. Cells clustered into four distinct populations: three adipose tissue-resident macrophage subtypes and one large, homogeneous population of ASCs. While pseudotemporal ordering analysis indicated that the ASCs were in slightly different differentiation stages, the differences in gene expression were small and could not distinguish distinct ASC subtypes. Altogether, in healthy individuals, ASCs seem to constitute a single homogeneous cell population that cannot be subdivided by single cell transcriptomics, suggesting a common origin for human adipocytes in scWAT.

Keywords: Adipocyte progenitor; Human adipose tissue; Mesenchymal stem cells; Single cell sequencing.


Conflict of interest statement

Authors’ information

KK’s current address is Departments of Medicine and Genetics, Stanford University, Stanford, CA 94305, USA.

Ethics approval and consent to participate

The study was approved by the regional ethics board at Karolinska Institutet and all subjects provided their written informed consent.

Consent for publication

Written informed consent was obtained from the patients for recording/using their individual details (age, gender, weight, and height) for research purposes. Samples were coded at the collection point and cannot by any means be connected to personal identity. The consent form is held in the patients’ clinical notes and is available for review by the Editor-in-Chief.

Competing interests

The authors declare that they have no competing interests.

Publisher’s Note

Springer Nature remains neutral with regard to jurisdictional claims in published maps and institutional affiliations.

Figures

Fig. 1
Fig. 1
a First-level clustering of SVF cells from scWAT. Left: cell–cell (upper) and gene–gene (lower) distance matrices of cells and genes ordered according to cluster membership determined by first-level clustering. Pearson correlation used as distance metric. Right: heatmap showing normalized expression of genes (rows) over all cells (columns) in the dataset. Cells and genes ordered as shown on the left. Upper panel shows Patient ID membership of cells, while lower panel shows cluster membership. b t-SNE plot showing visualization of WAT cells in 2-dimensional space. Cells colored according to cluster membership introduced in (a). c Violin plots showing the most differentially expressed genes in each WAT cluster based on negative binominal regression analysis. A gene is defined as differentially expressed in a population if its posterior probability (PP) exceeds the PP of all other populations with at least 99% probability. Genes shown were selected from all significant differentially expressed genes according to distance between the median expression in the relevant population (colored violin) compared to second highest median expression in any other population (gray violin). d Expression of two top genes representing each cluster/t-SNE population (c) in flow cytometry-sorted WAT cell populations. Expression measurement performed by Affymetrix Clariom™D microarray, normalized values compared (n = 6). e t-SNE plots showing expression of selected WAT marker genes over the dataset. ATM adipose tissue macrophage, FACS fluorescence-activated cell sorting, t-SNE t-distributed stochastic neighbor embedding, hWAT human white adipose tissue
Fig. 2
Fig. 2
a Second-level clustering of ASCs. Left: cell–cell (upper) and gene–gene distance matrices (lower) of cells and genes ordered according to cluster membership determined by first-level clustering. Pearson correlation used as distance metric. Right: heatmap showing normalized expression of genes (rows) over all cells (columns) in the dataset. Cells and genes ordered as shown on the left. Upper panel shows total number of unique molecules per cell, while lower panel shows cluster membership. Apparent from both the heatmap and the cell–cell clustering, there were no apparent subpopulations of ASCs present in the data. b t-SNE visualization of ASCs based on gene modules selected in a. A minimum spanning tree through the data and the corresponding diameter path are shown. Cells colored according to position in pseudotime. c Rolling-wave plot showing the spline-smoothed expression patterns of significant pseudotime-dependent genes ordered according to pseudotime point of peak expression. Upper panel shows pseudotime position of ASCs colored according to patient ID. Lowest panel shows position of four pseudotime bins corresponding to the most prominent expression patterns. Example genes peaking in all four bins shown on the right. d Expression patterns of example genes introduced in C projected onto t-SNE visualization of ASCs (left) and SVF cells (right). e Position of pseudotime bins introduced in C projected onto t-SNE visualization of ASCs (left) and SVF cells (right)

References

    1. Arner P. Human fat cell lipolysis: biochemistry, regulation and clinical role. Best Pract Res Clin Endocrinol Metab. 2005;19:471–82. doi: 10.1016/j.beem.2005.07.004. - DOI - PubMed
    1. Guilherme A, Virbasius JV, Puri V, Czech MP. Adipocyte dysfunctions linking obesity to insulin resistance and type 2 diabetes. Nat Rev Mol Cell Biol. 2008;9:367–77. doi: 10.1038/nrm2391. - DOI - PMC - PubMed
    1. Spalding KL, Arner E, Westermark PO, Bernard S, Buchholz BA, Bergmann O, et al. Dynamics of fat cell turnover in humans. Nature. 2008;453:783–7. doi: 10.1038/nature06902. - DOI - PubMed
    1. Arner E, Westermark PO, Spalding KL, Britton T, Ryden M, Frisen J, et al. Adipocyte turnover: relevance to human adipose tissue morphology. Diabetes. 2010;59:105–9. doi: 10.2337/db09-0942. - DOI - PMC - PubMed
    1. Arner E, Ryden M, Arner P. Tumor necrosis factor alpha and regulation of adipose tissue. N Engl J Med. 2010;362:1151–3. doi: 10.1056/NEJMc0910718. - DOI - PubMed