. 2017 Nov 7;8(1):1356.
doi: 10.1038/s41467-017-01291-z.

A method for measuring the distribution of the shortest telomeres in cells and tissues

Affiliations

A method for measuring the distribution of the shortest telomeres in cells and tissues

Tsung-Po Lai et al. Nat Commun. .

Abstract

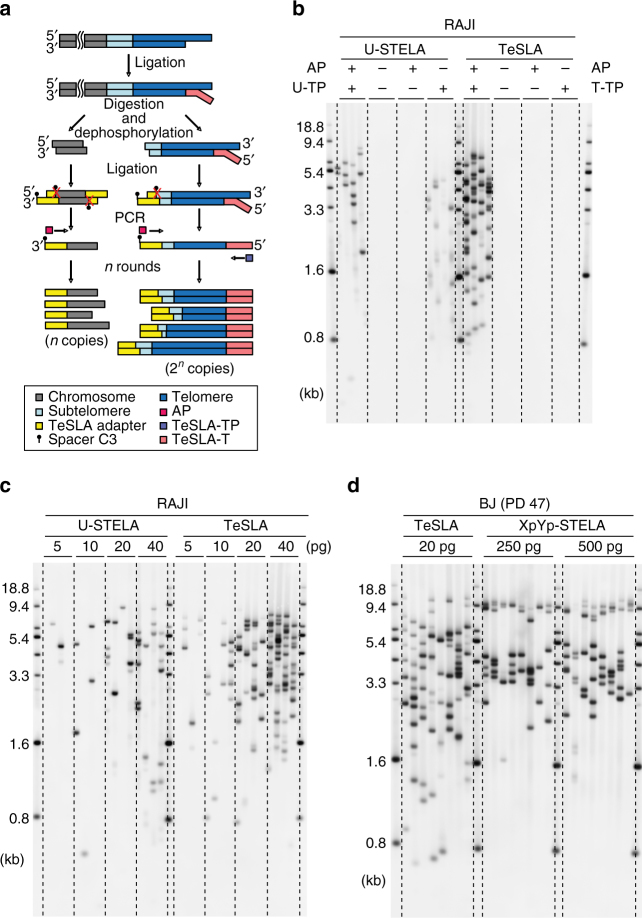
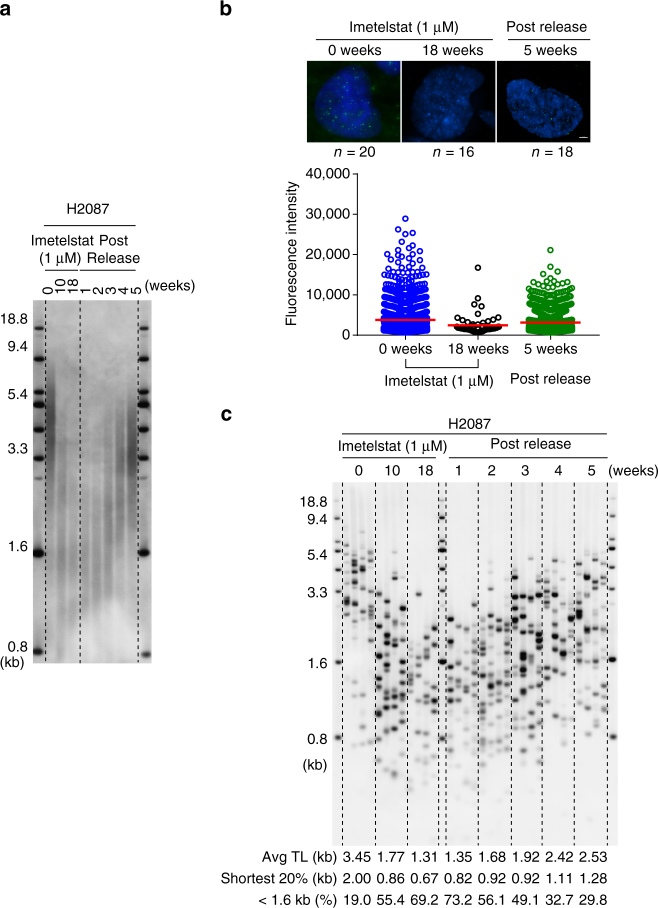
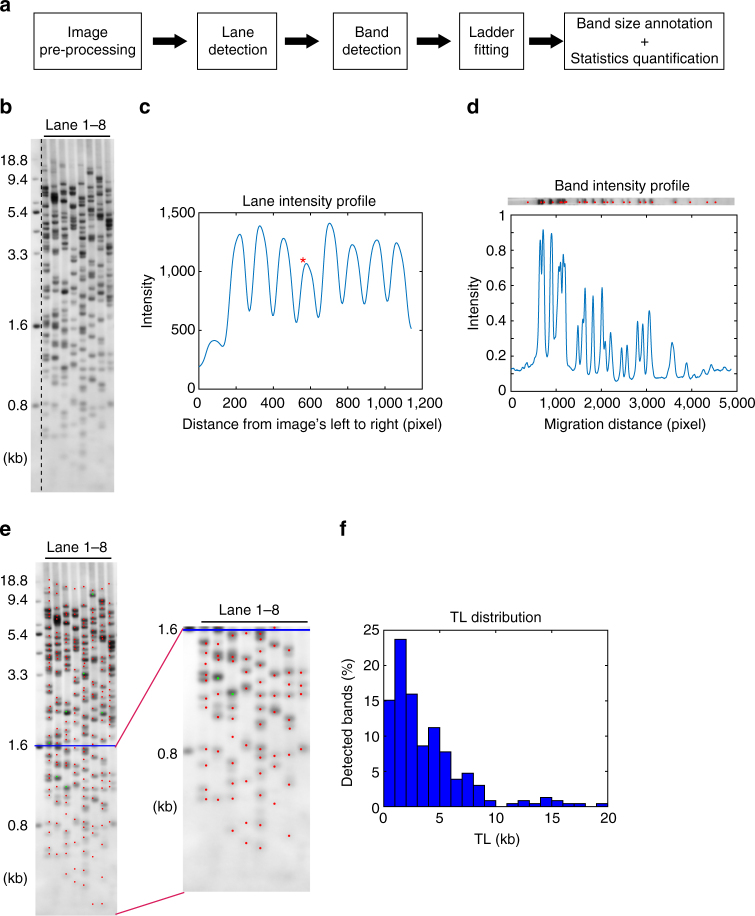
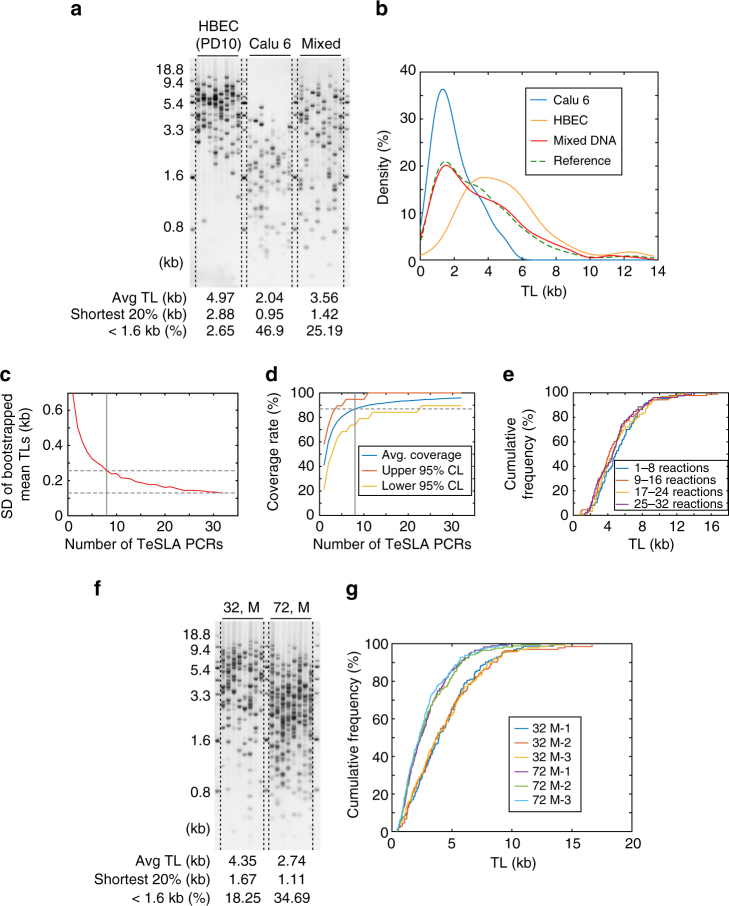
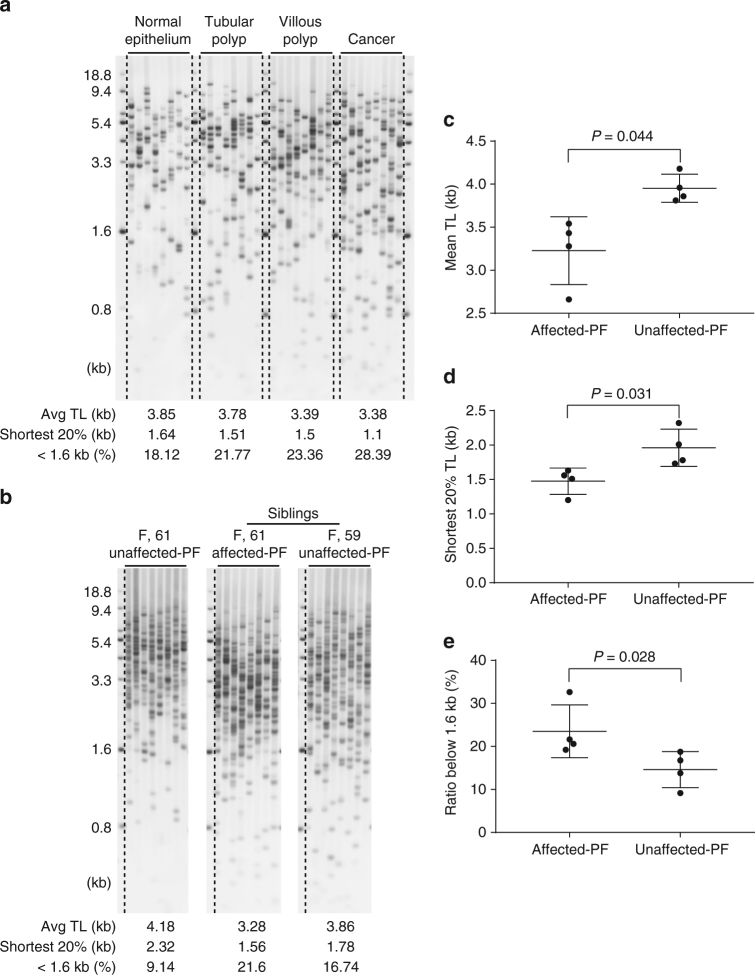
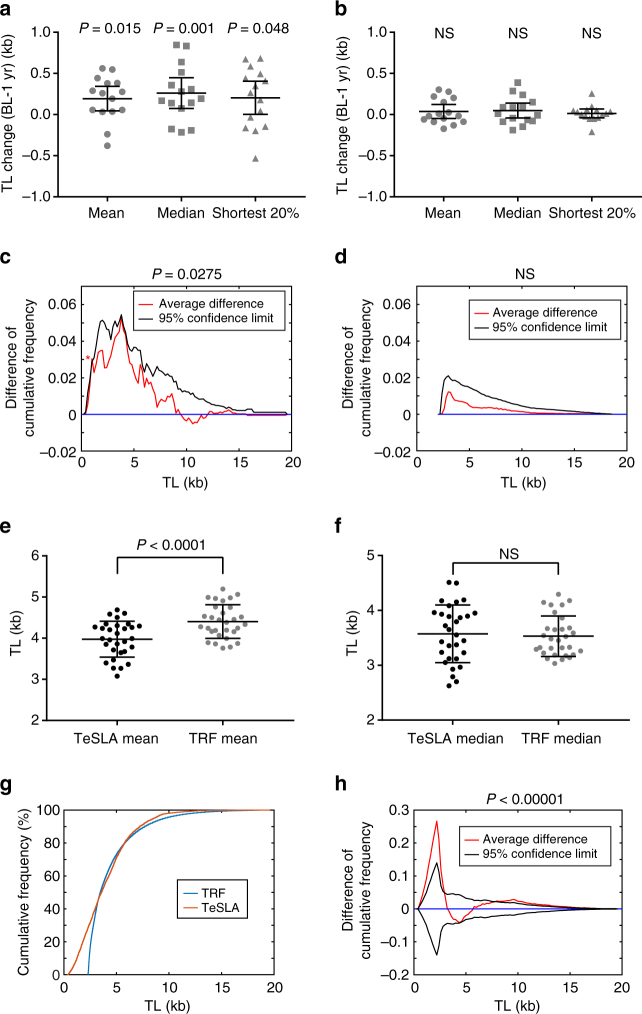
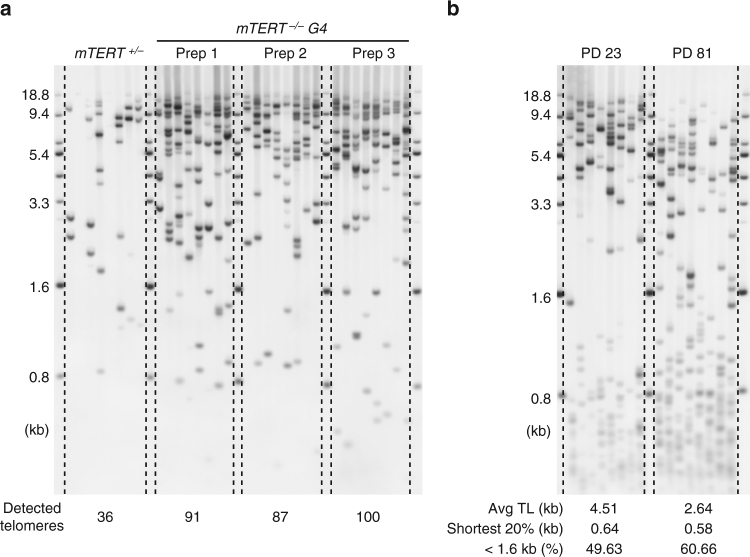
Improved methods to measure the shortest (not just average) telomere lengths (TLs) are needed. We developed Telomere Shortest Length Assay (TeSLA), a technique that detects telomeres from all chromosome ends from <1 kb to 18 kb using small amounts of input DNA. TeSLA improves the specificity and efficiency of TL measurements that is facilitated by user friendly image-processing software to automatically detect and annotate band sizes, calculate average TL, as well as the percent of the shortest telomeres. Compared with other TL measurement methods, TeSLA provides more information about the shortest telomeres. The length of telomeres was measured longitudinally in peripheral blood mononuclear cells during human aging, in tissues during colon cancer progression, in telomere-related diseases such as idiopathic pulmonary fibrosis, as well as in mice and other organisms. The results indicate that TeSLA is a robust method that provides a better understanding of the shortest length of telomeres.


Conflict of interest statement

The authors declare no competing financial interests.

Figures

Fig. 1
Fig. 1
Overview of Telomere Shortest Length Assay (TeSLA) and comparison to Universal STELA (U-STELA) and XpYp STELA. a Schematic of overall TeSLA methods. Extracted genomic DNA is ligated with TeSLA-Ts (each TeSLA-T contains seven nucleotides of telomeric C-rich repeats at the 3′ end) at the overhangs of telomeres and then digested with a restriction enzyme panel. Digested DNA is subsequently ligated with doubled-stranded TeSLA adapters at the proximal end of telomeres and genomic DNA fragments. After adapter ligation, PCR is performed to amplify ligated telomeric DNA. b About 40 pg of DNA from RAJI cells was used in each U-STELA and TeSLA reaction to test specificity of primers for telomere amplification and was tested as indicated (AP, adapter primer; U-TP, U-STELA teltail primer; T-TP, TeSLA-TP). c The sensitivity of U-STELA and TeSLA was compared by serial dilution of DNA from RAJI cells from 5 to 40 pg. d Using TeSLA (20 pg DNA for each reaction) and XpYp STELA (250 and 500 pg of DNA for each reaction) to detect TL in BJ cells
Fig. 2
Fig. 2
Measuring TL in long-term telomerase inhibition with imetelstat (1 µM) treatment and after the removal of drug in H2087 cells. a Isolated DNA from H2087 cells with 1 µM imetelstat treatment for 0, 10, and 18 weeks, and post released from 18 weeks for 1, 2, 3, 4, and 5 weeks was digested with the same REs for TeSLA (BfaI/CviAII/MseI/NdeI) and then separated on 0.7% agarose gel for TRF analysis. b Interphase Q-FISH; cells from H2087 with 0 and 18 weeks 1 µM imetelstat treatment, and 5 weeks after drug removal were used to measure TL by Q-FISH. The results were quantified using TFL-Telo software (n: numbers of nuclei were quantified for each time point as indicated above). Scale bar, 3 µm. c Results of TeSLA using DNA as indicated. Four TeSLA PCRs (30 pg of each reaction) were performed for each DNA sample
Fig. 3
Fig. 3
Overview of TeSLA image quantification software. a The computational analysis pipeline automatically detects each telomere band location, then annotates the band sizes, and calculates the relevant statistics (e.g., average TL, the ratio of shortest TL, TL at 20th percentile, and telomeres below 1.6 kb). b Example of input TeSLA image, tiff format recommended. On the left side of the image is the ladder lane with a standard size of 0.8–18.8 kb. c Lane profile, generated by summarizing the pixel intensity values vertically from left to right. Each peak indicates one lane detected by the software. d Band profile of lane 4, marked with the asterisk in c. The band profile is generated for each lane by horizontally summarizing pixel intensity values. Each significant peak refers to an individual band. e Example of the final output with the zoom-in of shortest telomere bands. Red dots indicate individual bands. Green dots mark the overlapping bands that are counted twice or three times. The blue line crosses the marker of 1.6 kb, which is the default threshold of shortest TL that other methods cannot reach. The software can calculate the ratio of TL below any given threshold. f Histogram of TL distribution, which covers the range of 0–20 kb
Fig. 4
Fig. 4
Assessment of different variations of TeSLA. a TeSLA of human bronchial epithelial cells (HBECs), Calu 6 (lung cancer cell line), and mixed DNA (HBEC: Calu 6 = 1:1) using 30 pg of DNA for each TeSLA PCR. b The kernel density estimation of TL from TeSLA results of Calu 6 (blue), HBEC (orange), and mixed DNA (red). The reference line (green dashed) represents a theoretical density function of TeSLA results when HBEC: Calu 6 = 1:1. c Standard deviations of bootstrapped distributions of mean TLs computed from 32 TeSLA PCRs of HBECs (Supplementary Fig. 4a) show the estimation accuracy achieved by using n (1 ≤ n ≤ 32) lanes to estimate the mean TL. d Coverage rates estimated from 32 TeSLA PCRs of HBECs (Supplementary Fig. 4a) based on bootstrapping. When eight PCRs were randomly selected from the 32 PCRs, 87% of all telomeres were detected with bin sizes 0.5 kb ranging from 0 to 10 kb. Red (yellow) line indicates upper (lower) 95% confidence bounds of the coverage rates. e Empirical distribution curves of quadruplets (eight TeSLA PCRs of each) from TeSLA results for HBECs show no significant changes in each eight TeSLA PCRs. f Representative TeSLA results of PBMCs from a young (age 32) and an old (age 72) individual. g Empirical distribution curves of TLs from the TeSLA of the triplicate results (blue, red, and yellow lines) for the 32-year-old male and triplicate results for the 72-year-old male (purple, green, and sky blue lines)
Fig. 5
Fig. 5
Using TeSLA to determine TL and distribution of telomeres in colon cancer progression and idiopathic pulmonary fibrosis (IPF) siblings compared to age-matched normal controls. a TeSLA results of normal colorectal epithelium, adenomas (tubular polyp and villous polyp), and colon cancer tissues from one colon cancer patient show shorter mean TL and increasing amount of the shortest telomeres in adenomas and cancer tissues compared to normal colorectal epithelium. b Using TeSLA to determine TLs of DNA isolated from circulated leukocytes of the unrelated normal control, siblings with and without IPF. The age and gender are indicated above each TeSLA results. ce Scatter plots of mean TL of TeSLA (c), the shortest 20% of telomeres (d), and percent of the shortest TL (<1.6 kb) (e) are shown for family members that have no IPF (three unrelated controls and a family member without IPF) and four family members with IPF. (ce mean and s.e.m., n = 4)
Fig. 6
Fig. 6
TeSLA is sensitive enough to detect changes of TLs in a 1-year period of normal human aging. a, b Scatter dot blots comparing TLs in PBMCs measured at baseline and in 1-year period by TeSLA (a) and TRF analysis (b). The mean, the median, and the shortest 20% TLs of 15 normal healthy subjects (age from 51 to 69) were averaged. P-values from paired t-tests are shown as indicated above. BL, baseline; 1 yr, one year after; NS, not significant. c, d The average changes of TL distributions in PBMCs in a 1-year period of 15 subjects measured by TeSLA (c) and TRF analysis (d). One-year differences in cumulative frequencies from each subject were computed (see Supplementary Fig. 5e, f as examples). The average of 1-year changes in TL distributions of 15 subjects is shown in red, and one-sided 95% confidence limit (black) is derived from permutation. The asterisk represents the value (~1 kb of TL) that lies outside the 95% confidence limit, which indicates the most significant effect on telomere shortening. e, f Scatter plots comparing TeSLA and TRF analysis for mean (e) and median (f) TL measurements (n = 30) in PBMCs. g Comparison of TeSLA and TRF analysis of empirical distribution curves of pooled TLs from all 30 DNA samples. h The averaged differences (red) in cumulative frequencies (TeSLA-TRF) by the same method used in c and d show large difference between TeSLA and TRF in the short TL analyses (0.6–2.8 kb). Black lines are 95% confidence limits obtained from permutation. (a, b; mean and s.e.m., n = 15) (e, f; mean and s.e.m., n = 30)
Fig. 7
Fig. 7
TeSLA for telomere detections in mTERT knockout mice and lung fibroblasts from a bowhead whale. a DNA extracted from mTERT +/− and mTERT −/− (4th generation, G4) mouse liver tissues were used to perform TeSLA (30 pg for each TeSLA reaction). Detected telomeres of three individual genomic DNA preps from the same mTERT −/− G4 mouse (91, 87, and 100 bands) are considerably more than telomeres that were detected from mTERT +/− liver tissue (36 bands). b TeSLA results of high-quality DNA extracted from early (PD 23) and late (PD 81) passages of cultured bowhead whale lung fibroblasts. Both early and late passage cells contain a subset of the shortest telomeres that have not been identified by TRF analysis

References

    1. Palm W, de Lange T. How shelterin protects mammalian telomeres. Annu. Rev. Genet. 2008;42:301–334. doi: 10.1146/annurev.genet.41.110306.130350. - DOI - PubMed
    1. Olovnikov AM. A theory of marginotomy. The incomplete copying of template margin in enzymic synthesis of polynucleotides and biological significance of the phenomenon. J. Theor. Biol. 1973;41:181–190. doi: 10.1016/0022-5193(73)90198-7. - DOI - PubMed
    1. Watson JD. Origin of concatemeric T7 DNA. Nat. New Biol. 1972;239:197–201. doi: 10.1038/newbio239197a0. - DOI - PubMed
    1. Fitzpatrick AL, et al. Leukocyte telomere length and cardiovascular disease in the cardiovascular health study. Am. J. Epidemiol. 2007;165:14–21. doi: 10.1093/aje/kwj346. - DOI - PubMed
    1. Sampson MJ, Winterbone MS, Hughes JC, Dozio N, Hughes DA. Monocyte telomere shortening and oxidative DNA damage in type 2 diabetes. Diabetes Care. 2006;29:283–289. doi: 10.2337/diacare.29.02.06.dc05-1715. - DOI - PubMed

Publication types