Cingulate island sign temporally changes in dementia with Lewy bodies
- PMID: 29116145
- PMCID: PMC5677123
- DOI: 10.1038/s41598-017-15263-2
Cingulate island sign temporally changes in dementia with Lewy bodies
Abstract
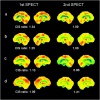
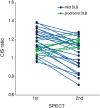
The cingulate island sign (CIS) that reflects sparing of the posterior cingulate cortex (PCC) relative to the precuneus plus cuneus on FDG-PET and brain perfusion SPECT, has been proposed as a feature of dementia with Lewy bodies (DLB). As the CIS is influenced by concomitant Alzheimer's disease (AD)-type neurofibrillary tangle (NFT) pathology, we postulated that the CIS gradually disappears as DLB progresses. To determine temporal changes in the CIS, 24 patients with mild DLB and 7 with prodromal DLB underwent 123I-IMP-SPECT and MMSE twice at an interval of two years. The CIS was evaluated as a ratio that was derived by dividing IMP accumulation in the PCC with that in the precuneus plus cuneus. We found that the CIS changed over time and that the relationship between CIS ratios and MMSE scores was inverted U-shaped. Thus, the CIS was most obvious in the vicinity of an MMSE score of 22 and it gradually diminished as the MMSE score decreased. Moreover, a lower CIS ratio in mild DLB was associated with a worse prognosis for cognitive decline, presumably due to concomitant AD-type NFT pathology. Our findings would provide a foundation for the appropriate usage of CIS as a biomarker.
Conflict of interest statement
The authors declare that they have no competing interests.
Figures


Similar articles
-
Cingulate island sign on FDG-PET is associated with medial temporal lobe atrophy in dementia with Lewy bodies.Ann Nucl Med. 2016 Jul;30(6):421-9. doi: 10.1007/s12149-016-1076-9. Epub 2016 Apr 20. Ann Nucl Med. 2016. PMID: 27098829
-
The Cingulate Island Sign on FDG-PET vs. IMP-SPECT to Assess Mild Cognitive Impairment in Alzheimer's Disease vs. Dementia with Lewy Bodies.J Neuroimaging. 2019 Nov;29(6):712-720. doi: 10.1111/jon.12643. Epub 2019 Jun 14. J Neuroimaging. 2019. PMID: 31199036
-
Dementia with Lewy bodies: basis of cingulate island sign.Neurology. 2014 Aug 26;83(9):801-9. doi: 10.1212/WNL.0000000000000734. Epub 2014 Jul 23. Neurology. 2014. PMID: 25056580 Free PMC article.
-
Diagnostic imaging of dementia with Lewy bodies, frontotemporal lobar degeneration, and normal pressure hydrocephalus.Jpn J Radiol. 2020 Jan;38(1):64-76. doi: 10.1007/s11604-019-00881-9. Epub 2019 Sep 23. Jpn J Radiol. 2020. PMID: 31549279 Review.
-
Brain perfusion SPECT in dementia: what radiologists should know.Jpn J Radiol. 2024 Nov;42(11):1215-1230. doi: 10.1007/s11604-024-01612-5. Epub 2024 Jun 18. Jpn J Radiol. 2024. PMID: 38888851 Free PMC article. Review.
Cited by
-
Brain Perfusion Single-Photon Emission Computed Tomography Using an Easy Z-Score Imaging System Predicts Progression to Neurodegenerative Dementia in Rapid Eye Movement Sleep Behavior Disorder.Dement Geriatr Cogn Disord. 2021;50(6):577-584. doi: 10.1159/000521645. Epub 2022 Jan 31. Dement Geriatr Cogn Disord. 2021. PMID: 35100582 Free PMC article.
-
Neuroanatomical and clinical correlates of prodromal dementia with Lewy bodies: a systematic literature review of neuroimaging findings.J Neurol. 2024 Dec 12;272(1):38. doi: 10.1007/s00415-024-12726-1. J Neurol. 2024. PMID: 39666108
-
Mild cognitive impairment with Lewy bodies: blood perfusion with arterial spin labelling.J Neurol. 2021 Apr;268(4):1284-1294. doi: 10.1007/s00415-020-10271-1. Epub 2020 Oct 21. J Neurol. 2021. PMID: 33084940 Free PMC article.
-
Atypical Parkinsonian Syndromes: Structural, Functional, and Molecular Imaging Features.AJNR Am J Neuroradiol. 2024 Dec 9;45(12):1865-1877. doi: 10.3174/ajnr.A8313. AJNR Am J Neuroradiol. 2024. PMID: 39209485 Review.
-
Clinical validity and reproducibility of a visual rating scale for cingulate island sign in a real-world memory clinic: An FDG-PET/MRI study.Eur J Neurol. 2025 Jan;32(1):e70015. doi: 10.1111/ene.70015. Eur J Neurol. 2025. PMID: 39723490 Free PMC article.
References
MeSH terms
Substances
LinkOut - more resources
Full Text Sources
Other Literature Sources
Medical
Research Materials

