. 2017 Nov 7;7(1):14767.
doi: 10.1038/s41598-017-15200-3.

The EphB6 receptor is overexpressed in pediatric T cell acute lymphoblastic leukemia and increases its sensitivity to doxorubicin treatment

Affiliations

The EphB6 receptor is overexpressed in pediatric T cell acute lymphoblastic leukemia and increases its sensitivity to doxorubicin treatment

Amr El Zawily et al. Sci Rep. .

Abstract

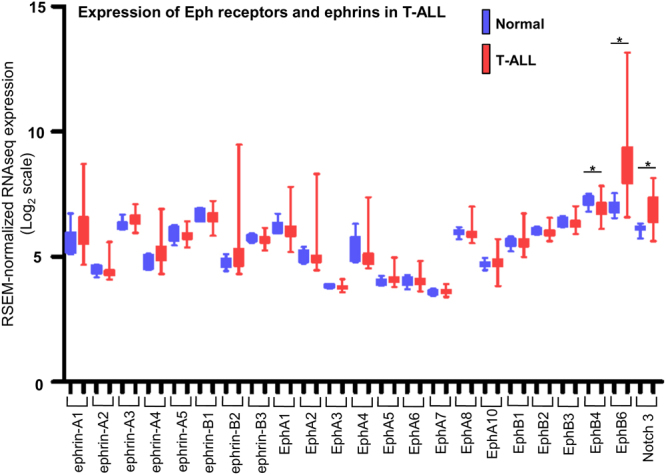
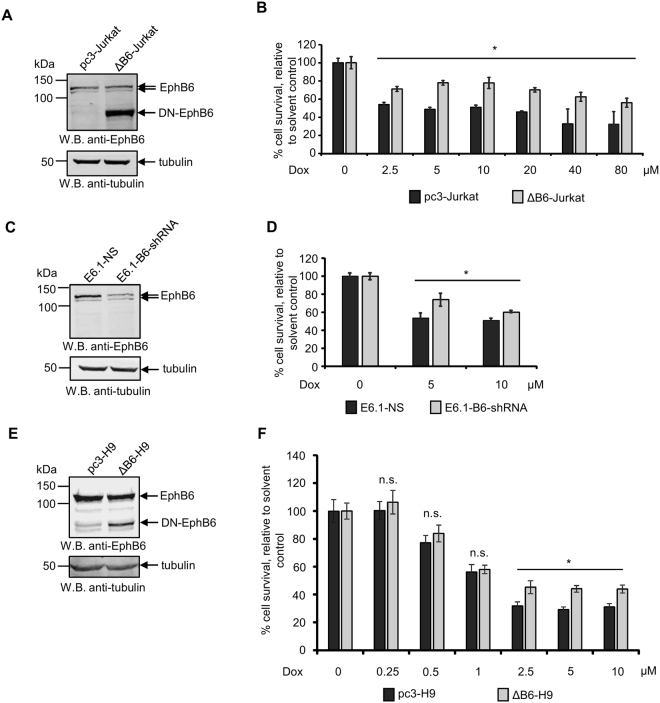
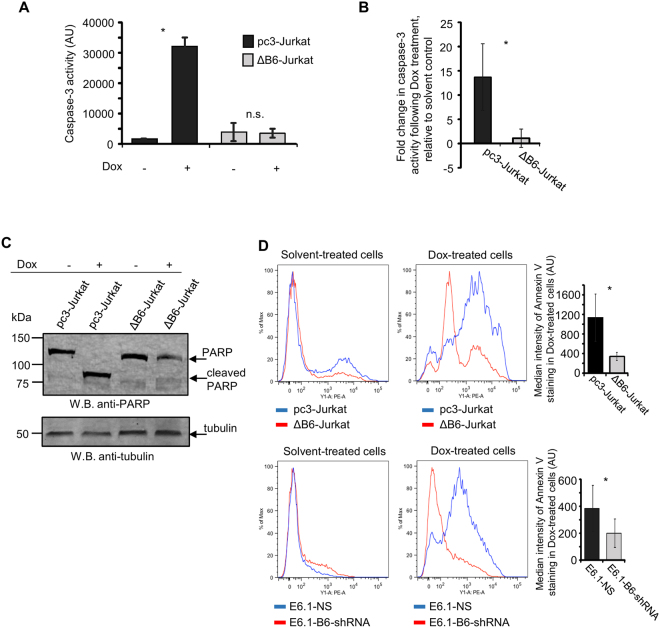
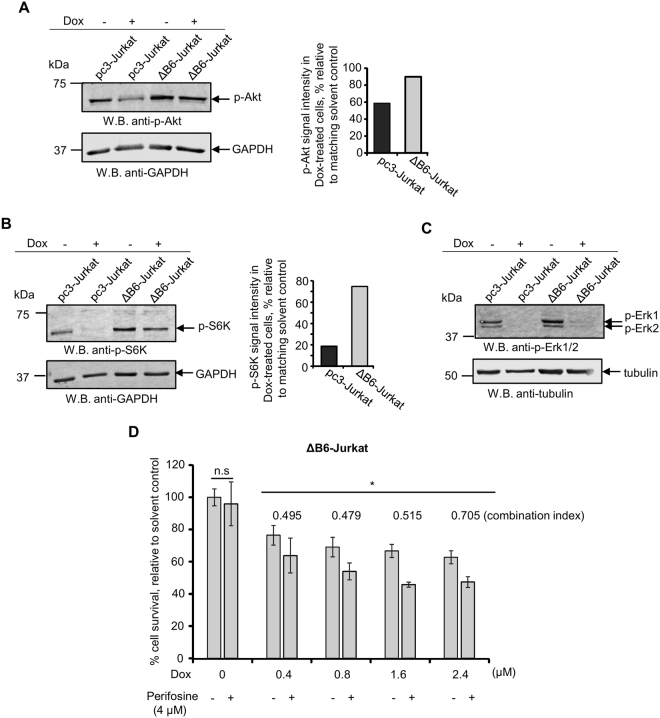
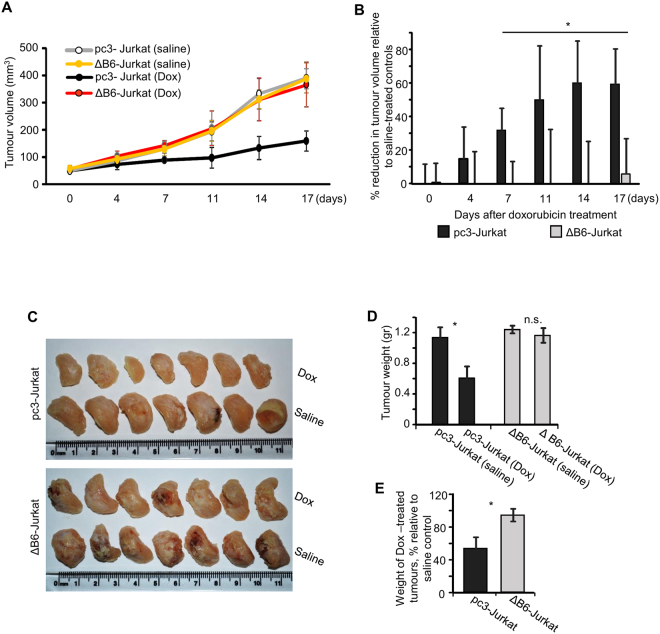
While impressive improvements have been achieved in T-ALL therapy, current treatment approaches fail in approximately 25% of patients and these patients have limited treatment options. Another significant group of patients is being overtreated, which causes long-lasting side effects. Identification of molecules controlling drug resistance in T-ALL is crucial for treatment optimisation in both scenarios. We report here the EphB6 receptor is frequently overexpressed in T-ALL. Remarkably, our observations indicate that EphB6 acts in T-ALL cells to enhance sensitivity to a DNA-damaging drug, doxorubicin, as interruption of EphB6 activity interferes with the efficiency of doxorubicin-induced eradication of T-ALL cells in cell culture and in xenograft animals. This effect relies on the protection of Akt kinase signaling, while Akt inhibition combined with doxorubicin application produces synergistic effects on the elimination of EphB6-deficient T-ALL cells. These data imply that EphB6 suppresses T-ALL resistance by interfering with Akt activity. Our observations highlight a novel role for EphB6 in reducing drug resistance of T-ALL and suggest that doxorubicin treatment should produce better results if personalised based on EphB6 levels. If successfully verified in clinical studies, this approach should improve outcomes for T-ALL patients resistant to current therapies and for patients, who are being overtreated.


Conflict of interest statement

The authors declare that they have no competing interests.

Figures

Figure 1
Figure 1
EPHB6 is overexpressed in T-ALL patient samples. Eph receptor and ephrin expression was analyzed in 117 pediatric T-ALL patient samples and 7 matching normal tissue controls using data from the European Bioinformatics Institute. Statistical significance was computed using the Mann-Whitney U test. Expression of the Notch3 receptor that is upregulated in T-ALL is shown as a reference.
Figure 2
Figure 2
Suppression of EphB6 action supports survival of doxorubicin-treated cells. (A) Western blot analysis of EphB6 expression in Jurkat cells stably transfected with a cytoplasmic domain-deleted dominant-negative mutant (DN-EphB6) of EphB6 (ΔB6-Jurkat) or mock-transfected with the empty pcDNA3 expression vector (pc3-Jurkat). Western blotting with anti-tubulin was used as a loading control. (B) pc3-Jurkat and ΔB6-Jurkat cells (4 × 104 cells per well in 96 well plates) were treated with the indicated doxorubicin (Dox) concentrations or a matching solvent control for 24 hours at 37 °C and 5% CO2. Cells were stained with resazurin and cell survival was quantitated using a SpectraMax M5 plate reader. The graph represents the analysis of five replicates and shows the percentage of survival of Dox-treated cells relative to matching solvent-treated cells. (C) E6.1 cells were transduced with EphB6-targeting shRNA (E6.1-B6-shRNA) or non-silencing shRNA (E6.1-NS). EphB6 expression was analysed by Western blotting with anti-EphB6. Western blotting with anti-tubulin was used as a loading control. (D) E6.1-NS and E6.1-B6-shRNA cells (4 × 104 cells per well in 96 well plates) were treated with Dox or a matching solvent control for 24 hours. Cells were stained with resazurin and cell survival was measured using a SpectraMax M5 plate reader. The graph represents analysis of five replicates and shows the percentage of survival of Dox-treated cells relative to the survival of solvent-treated cells. (E) Human malignant lymphoblastic T cells, H9, were electroporated with the pcDNA3 expression vector encoding a DN-EphB6 mutant (ΔB6-H9) or mock-transfected with empty pcDNA3 as a control (pc3-H9), and cells were subjected to 30 days selection with 1 mg/ml of G418. Expression of DN-EphB6 was confirmed by Western blotting. (F) ΔB6-H9 and pc3-H9 cells were treated with the indicated concentrations of Dox or solvent control and cell survival was analysed by resazurin staining as in (B). All experiments were performed at least three times. To optimize presentation, anti-EphB6 and anti-tubulin Western blot images are shown at different brightness and contrast settings. Full-length unadjusted Western blot images for this figure are shown in Supplementary Fig. 1A–C. *P < 0.05, Student’s t-test. n.s., statistically not significant.
Figure 3
Figure 3
Disruption of EphB6 activity prevents induction of apoptosis in response to doxorubicin treatment. (A,B) ΔB6-Jurkat and pc3-Jurkat cells (1 × 106 cells per well in 6 well plates) were treated in triplicates with 5 µM Dox or a matching solvent control in serum-free medium, for 14 hours. Caspase-3 activity was quantified using the EnzChek® CASPASE-3 Assay kit #1 (Invitrogen) according to the manufacturer’s instructions. (A) The graph shows caspase-3 activity in arbitrary units (AU), as measured at A442 using a SpectraMax M5 plate reader, and represents analysis of one of three independent experiments. (B) The graph shows fold-change in caspase-3 activity following Dox treatment, compared to a matching solvent control and represents analysis of three independent experiments. (C) ΔB6-Jurkat and pc3-Jurkat cells were treated with 5 µM Dox for 14 hours at 37 °C and 5% CO2. Cells were lysed and cell lysates were resolved by SDS PAGE. PARP cleavage was analysed by Western blotting with anti-PARP. Western blotting with anti-tubulin was used as a loading control. To optimize presentation, anti-PARP and anti-tubulin Western blot images are shown at different brightness and contrast settings. (D) The indicated cells were treated with 5 µM Dox, or a matching solvent control, for 24 hours. Cells were stained with PE-conjugated Annexin V for 15 minutes in the dark at room temperature and analyzed by flow cytometry. The graphs on the right show median intensities of Annexin V staining of Dox-treated cells after the subtraction of values corresponding to median staining intensities of matching solvent-treated controls. The graphs represent analyses of three independent experiments performed in duplicates. The analyses were done using the FlowJo software. All experiments were done at least three times. Full-length unadjusted Western blot images for this figure are shown in Supplementary Fig. 2A. *, P < 0.05, Student’s t-test. n.s., statistically not significant.
Figure 4
Figure 4
Expression of EphB6 dominant-negative mutant preserves Akt activation in doxorubicin-treated T-ALL cells. (A) ΔB6-Jurkat and pc3-Jurkat cells (4 × 106 per well, in 6 well plates) were treated with 5 µM Dox in serum-free medium for 14 hours. Cell lysates were resolved by SDS PAGE and activating phosphorylation of the Akt kinase was examined by Western blotting with anti-phospho-Akt, recognising Akt phosphorylation at Ser473 (anti-p-Akt). Western blotting with anti-GAPDH was used as a loading control. Akt phosphorylation was quantified by densitometry using Carestream software and measurements were normalized to matching GAPDH controls. The graph represents a reduction in p-Akt signal intensity in Dox-treated cells as a percentage relative to the matching solvent controls. To optimize presentation, anti-p-Akt and anti-GAPDH images are shown at different brightness and contrast settings. (B) Cells were treated as in (A) and phosphorylation of the p70 S6 kinase was analysed by Western blotting with anti-phospho-S6K (anti-p-S6K). Phosphorylation of p70-S6K was quantified and presented as in (A). To optimize presentation, anti-p-S6K and anti-GAPDH images are shown at different brightness and contrast settings. (C) Cells were treated as in (A) and activating phosphorylation Erk kinases was analysed by Western blotting with anti-phospho-Erk (anti-p-Erk1/2). Western blotting with anti-tubulin used as a loading control. To optimize presentation, anti-p-Erk1/2 and anti-tubulin images are shown at different brightness and contrast settings. (D) ΔB6-Jurkat (4 × 104 per well, in 96 well plates) were treated in triplicates with the indicated concentrations of Dox and with a suboptimal concentration of Perifosine individually, or in combination for 24 hours at 37 °C and 5% CO2. Cells were stained with resazurin and cell survival was monitored using a SpectraMax M5 plate reader. Data are shown as a percentage of cell survival in drug-treated populations relative to matching solvent controls. The synergistic effect of Dox/Perifosine combinations was calculated using CompuSyn software and is presented as combination indices for each drug combination. Indices below 0.9 indicate synergism. All experiments were done at least three times. Full-length unadjusted Western blot images for this figure are shown in Supplementary Fig. 3A–C. *, P < 0.05, Student’s t-test. n.s., statistically not significant.
Figure 5
Figure 5
Inhibition of EphB6 action enhances drug-resistance of T-ALL cells in vivo. (AE) ΔB6-Jurkat and pc3-Jurkat cells were resuspended in PBS and mixed 1:1 with Corning Matrigel Matrix. Cells (3 × 106) were injected in a total volume of 100 µL subcutaneously into the right flank of NOD-SCID mice. As tumours reached a measurable size, mice were treated weekly with intravenous injections of Dox (2 mg/kg) or a matching volume of saline control (n = 7 per group). Tumour growth was monitored twice a week by measurements with digital callipers and tumour volume was calculated by the equation: A/2*B2, where A was long and B was short diameter of the tumour (A). The reduction in tumour growth in Dox-treated mice is presented as a percentage relative to matching saline-treated controls (B). In panels (A and B), day 0 indicates the day, when both treatment and measurements were initiated. Upon experiment termination, tumours were extracted, fixed in 10% formalin, photographed (C) and weighed. The average tumour weight for each experimental group is shown (D). The graph in panel (E) represents average tumour weights in Dox-treated mice as a percentage relative to matching saline-treated controls. Data are shown as means ± SD. One of two independent experiments is shown. *P < 0.05; Student’s t-test. n.s., statistically not significant.

References

    1. Belver L, Ferrando A. The genetics and mechanisms of T cell acute lymphoblastic leukaemia. Nat Rev Cancer. 2016;16:494–507. doi: 10.1038/nrc.2016.63. - DOI - PubMed
    1. Karrman K, Johansson B. Pediatric T-cell acute lymphoblastic leukemia. Genes Chromosomes Cancer. 2017;56:89–116. doi: 10.1002/gcc.22416. - DOI - PubMed
    1. Girardi T, Vicente C, Cools J, De Keersmaecker K. The genetics and molecular biology of T-ALL. Blood. 2017;129:1113–1123. doi: 10.1182/blood-2016-10-706465. - DOI - PMC - PubMed
    1. Hebert J, Cayuela JM, Berkeley J, Sigaux F. Candidate tumor-suppressor genes MTS1 (p16INK4A) and MTS2 (p15INK4B) display frequent homozygous deletions in primary cells from T- but not from B-cell lineage acute lymphoblastic leukemias. Blood. 1994;84:4038–4044. - PubMed
    1. Weng AP, et al. Activating mutations of NOTCH1 in human T cell acute lymphoblastic leukemia. Science. 2004;306:269–271. doi: 10.1126/science.1102160. - DOI - PubMed

Publication types

MeSH terms

Grants and funding

LinkOut - more resources