. 2017 Nov 7;8(1):1346.
doi: 10.1038/s41467-017-01393-8.

Acetylated histone variant H2A.Z is involved in the activation of neo-enhancers in prostate cancer

Affiliations

Acetylated histone variant H2A.Z is involved in the activation of neo-enhancers in prostate cancer

Fátima Valdés-Mora et al. Nat Commun. .

Abstract

Acetylation of the histone variant H2A.Z (H2A.Zac) occurs at active promoters and is associated with oncogene activation in prostate cancer, but its role in enhancer function is still poorly understood. Here we show that H2A.Zac containing nucleosomes are commonly redistributed to neo-enhancers in cancer resulting in a concomitant gain of chromatin accessibility and ectopic gene expression. Notably incorporation of acetylated H2A.Z nucleosomes is a pre-requisite for activation of Androgen receptor (AR) associated enhancers. H2A.Zac nucleosome occupancy is rapidly remodeled to flank the AR sites to initiate the formation of nucleosome-free regions and the production of AR-enhancer RNAs upon androgen treatment. Remarkably higher levels of global H2A.Zac correlate with poorer prognosis. Altogether these data demonstrate the novel contribution of H2A.Zac in activation of newly formed enhancers in prostate cancer.


Conflict of interest statement

The authors declare no competing financial interests.

Figures
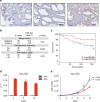
Fig. 1
Fig. 1
H2A.Zac has pro-oncogenic characteristics in prostate cancer. a Immunohistochemical staining of tissue microarrays for H2A.Zac total protein. Tissue microarrays were stained with H2A.Zac specific antibody (brown) and counterstained with hematoxylin (blue). Three representative tumor samples to show the scoring criteria used for differential H2A.Zac protein levels at × 20 magnification (Aperio ImageScope sofware). Left hand site (LHS), low levels, 0–10%; middle panel, moderate (50–65%) and right hand site, (RHS), strong staining (95–100%). Scale bar = 100 μm b Summary of the clinical parameters analyzed for H2A.Zac presence in 63 prostate tumor samples. Number of patients and mean value for H2A.Zac presence percentage are shown for each category. The associations between H2A.Zac status and discrete categorical variables were tested using the t-tests. c Kaplan-Meier plot of the survival analyses evaluating disease relapse was performed on the nuclear averaged H2A.Zac scores (Wald p-value = 0.044). The split into high and low was done on the basis of the median, H2A.Zac high (blue, >=80%) and H2A.Zac low (red, <80%). d Real-Time qPCR for the mRNA expression levels of 3R mutant form of H2A.Z in LNCaP cells over 10 days of daily Doxycycline (Dox) treatment. (N > 3). Data was normalized using the 2−ΔCt method. Error bars are shown as s.d. e Cell proliferation curve of the 3 R cells over 10 days of Dox treatment. Alive cells were automatically counted (N  > 4) on days 4, 6, 8, and 10 (* t-test p-value < 0.05 and ** t-test p-value < 0.001). The graph showed is a representative example of three independent experiments. Error bars are shown as s.d
Fig. 2
Fig. 2
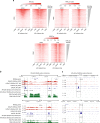
H2A.Zac occupancy at genomic regions in PrEC and LNCaP. a Genomic Association Test (GAT) of H2A.Zac ChIP-seq and ChromHMM regions in LNCaP and PrEC cells. A total number of 42,538 H2A.Zac intersecting peaks from biological replicates were detected in LNCaP and 31,479 H2A.Zac peaks in PrEC. Pie charts (upper panel) representing the percentage of marked H2A.Zac peaks falling in each ChromHMM state. Observed vs. expected fold enrichment graphs (lower panel), * p-value < 0.0001 of significant enrichment. The line indicates the threshold of the significant enrichment. b Ngs plots of the average signal (read count per million mapped reads) of H2A.Zac ChIP seq in LNCaP (red) and PrEC (green) cells for each genomic region of significant enrichment. The plots were centered at the transcriptional start site (TSS) in the case of active and bivalent promoters and at the midpoints of DNase I hypersensitive sites sequencing (DNAseI) peaks in the case of active or poised enhancers. c Heatmaps showing H2A.Zac ChIP-seq signal (ordered by H2A.Zac signal intensity from top to bottom) across all the assigned active and poised enhancers, according to ChromHMM. H2A.Zac was centered using DNAseI midpoint. Dashed line separates enhancers as “with H2A.Zac” or “ without H2A.Zac”. Scale bar shows the colorkey of the intensity of H2A.Zac ChIP average signal (read count per million mapped reads, RPM)
Fig. 3
Fig. 3
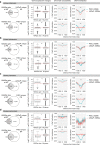
Aberrant H2A.Zac is highly remodeled at enhancers and promoters in cancer. a GAT analysis of the gained and lost peaks in LNCaP compared to PrEC at ChromHMM regions. A total number of 3680 peaks (300 bp bins) were gained and 5113 peaks (300 bp bins) were lost in LNCaP compared to PrEC. These peaks were then assigned to the different genomic regions called by ChromHMM; for the gained peaks it was compared with LNCaP ChromHMM and for the lost peaks the PrEC ChromHMM was used. GAT analyses were represented using pie charts (LHS of each panel) and observed vs. expected diagrams (RHS of each panel). * p-value < 0.0001 of significant enrichment. The line indicates the threshold of the significant enrichment. b Ngs plots of the of the average signal (read count per million mapped reads) of H2A.Zac gained (LHS) and lost (RHS) peaks in LNCaP (red) compared to PrEC (green) for each significant genomic regulatory region. The plots were centered to the transcriptional start site (TSS) in the case of active and bivalent promoters and to the midpoints of DNase I hypersensitive sites sequencing (DNAseI) peaks in the case of active or poised enhancers. c GAT analysis of the gained H2A.Zac peaks in VCaP compared to PrEC at VCaP ChromHMM regions. A total number of 6383 peaks (200 bp bins) were gained in VCaP compared to PrEC. These peaks were then assigned to the different genomic regions called by VCaP ChromHMM; GAT analyses were represented using pie charts (LHS) and observed vs. expected diagrams (RHS). * p-value < 0.0001 of significant enrichment. The line indicates the threshold of the positive vs. negative enrichment. d Pie charts of GAT analyses of LNCaP gained peaks (n = 1803, LHS) and VCaP gained peaks (n = 3104, RHS) at a neo-enhancers at PrEC ChromHMM regions
Fig. 4
Fig. 4
Epigenetic features of H2A.Zac re-distribution at genomic regulatory regions. LHS, Venn diagrams overlapping the H2A.Zac gained or lost peaks from each different regulatory region (from Fig. 3a) with the corresponding “unique” active enhancers a, poised enhancers b, active promoters c and bivalent promoters d. The terminology “unique” was used to call enhancers or promoters that were only present in LNCaP but not in PrEC, for the gained peaks; and the enhancers and promoters that were only present in PrEC but not in LNCaP for the lost peaks. Box plots were generated to address the correlation of gain and loss of H2A.Zac peaks at the unique enhancers (active, a and poised, b or promoters (active, c or bivalent d) with gene transcriptional regulation. The logarithmic fold change expression (logFC) of LNCaP minus PrEC was compared between all genes and the overlapping regions from the corresponding Venn diagrams. To associate gene expression with enhancers, all the genes upstream or downstream of a particular enhancer within a 25 kb window were assigned as an enhancer-gene association a and b RHS, two types of NOMe plots were generated to evaluate differential chromatin accessibility, (represented as 1 minus GpC methylation ratio) and differential DNA methylation 0–1 ratio) between LNCaP (red) and PrEC (green). The regions analyzed corresponded to the overlapping areas from the corresponding Venn diagrams for active enhancers a, poised enhancers b, active promoters c and bivalent promoters d. * t-test p-value < 0.05 ** t-test p-value < 0.001
Fig. 5
Fig. 5
H2A.Zac-promoter and enhancer remodeling of cancer-related genes. a University of California Santa Cruz (UCSC) genome browser hg19 screen shots of representative genes that exhibited remodeling of H2A.Zac at promoters and/or enhancers between PrEC and LNCaP. In these screen shots different types of data are presented for both PrEC and LNCaP cell lines (from top to bottom): ChromHMM color-coded according to the different states (see legend); merged tracks of H2A.Z (green) and H2A.Zac (red) ChIPseq signal (RPM); NOMe-seq tracks for chomatin accessibility (NOMe occupancy) in which 1-mGpC ratio (0–1) is represented as a gray bar in 100 bp smoothed resolution. NDRs were called from the NOMe-seq data (with a p-value cutoff of −log10(p) > 15) and are represented as black blocks (NOMe NDR); NOMe-seq tracks for DNA methylation (NOMe DNA methylation) in which mCpG ratio (0–1) is represented as a black bar in 100 bp smoothed resolution; Differences in DNA methylation ratio between LNCaP and PrEC (DNA methylation ∆LNCaP-PrEC) were calculated in each 100 bp bin, gray bars represent loss in LNCaP (negative value) and black bars represent gain in LNCaP (positive value). The dashed blue rectangles highlight the regions selected for the validation of the chromatin accessibility by targeted NOMe-seq (section b). All of the selected gene examples are androgen-regulated genes (based on expression array data and AR ChIP-seq) and are also up-regulated in LNCaP compared with PrEC as shown in Fig. S2A. b Targeted NOMe-seq validation of chromatin accessibility and its correlation with H2A.Zac presence. Upper panel, merged IGV tracks of PrEC (top) and LNCaP (bottom) cells showing H2A.Zac ChIP-seq signal (orange, 0–3 RPM) merged with targeted NOMe-seq data (dark blue bars blue bars, 0–1, represented as 0–1 ratio of each 1-mGpC site), of two enhancer regions, GREB1 and TRPM8 and one promoter region, KLK2. The bottom diagrams represent a magnification at the identified NDR of each genomic region were the x axis represents each GpC site and the y axis is the average ratio of 1-mGpC of each site, in PrEC (green) and LNCaP (red). The regions analyzed by targeted NOMeseq were CpG poor disabling us to obtain a comprehensive map for CpG methylation changes
Fig. 6
Fig. 6
H2A.Zac-nucleosome dynamics occurs at AR enhancers. a H2A.Zac ChIP-seq average intensity profile using Ngs plots during a time course of DHT treatment, from the control (EtOH), to the following DHT timepoints: 2 h, 4 h and 16 h in LNCaP cells and control (EtOH). The AR sites were split according to the presence of H2A.Zac at AR enhancers; the peaks that overlapped with LNCaP ChromHMM active enhancers were considered as AR enhancers. b NOMe plots representing chromatin accessibility at the AR enhancers with H2A.Zac (LHS) and without H2A.Zac (w/o) (RHS) during the different timepoints of DHT treatment. The dashed lines indicate the maximum accessibility at EtOH (red line) and 16 h (purple line). ** t-test p-value < 0.001. c LHS, IGV screen shots of the androgen-sensitive genes IQGAP2, GREB1 and TRPM8 showing the tracks for H2A.Zac ChIP-seq at EtOH and the different DHT timepoints (red) and AR ChIP-seq (blue) for EtOH and 4 h of DHT treatment. The dashed boxes indicate the AR binding site at the enhancer areas of these genes. RHS, gene expression of these genes across the DHT time course. These data was obtained from Affymetrix Human Gene 2.1 ST expression arrays and it is represented as logarithmic fold chance. *adjusted p-value < 0.05. d LHS, merged IGV tracks of control (EtOH) and DHT timepoints (2 h, 4 h and 16 h) showing H2A.Zac ChIP-seq signal (orange, RPM) overlapped with targeted NOMe-seq average signal, represented as 0–1 ratio of each 1-mGpC site (dark blue bars), of two AR enhancer regions for GREB1 and TRPM8 genes. The bottom two tracks correspond to AR ChIP-seq (gray, RPM) to show how the increase of accessibility correlates with AR binding. The diagrams at the RHS represent a magnification at the identified NDR of each genomic region where the x axis represents each GpC site and the y axis is the average ratio of 1-mGpC of each GpC site, in the DHT timecourse
Fig. 7
Fig. 7
AR enhancers flanked by H2A.Zac-nucleosomes have features of active enhancers. a Heatmap of H2A.Zac (LHS), RNA polymerase II phospho S5 (RNA pol II pS5, center) and H3K27ac (RHS) ChIP-seq data at AR enhancers (n = 2232) ordered by H2A.Zac signal intensity from highest (top) to lowest at starving conditions (EtOH) and DHT treatment (DHT). Scale bars show the colorkey of the intensity of each corresponding ChIP average signal (RPM). b IGV screen shots of representative examples for AR active enhancers with H2A.Zac (LHS) or c without H2A.Zac (RHS) (highlighted in a rectangle) showing H2A.Zac (red), AR (blue) and RNA pol II pS5 (green) ChIP-seq signal at these sites (RPM)
Fig. 8
Fig. 8
H2A.Zac is involved in androgen-dependent eRNA expression. Bidirectional histograms (+and – strands) of eRNA profile from GROseq data around AR enhancers during starvation (EtOH) and after DHT treatment (DHT) in the androgen responsive prostate cancer cell lines LNCaP a and VCaP b. AR ChromHMM-defined active enhancers were split into with/without H2AZac and centered on AR peaks as per Fig. 6a, obtaining 1309 and 808 overlaps for AR-enhancers with H2A.Zac and 923 and 1264 overlaps for AR-enhancers without H2A.Zac in LNCaP and VCaP, respectively. Note, four replicates were done for LNCaP GROseq and two replicates for VCaP GROseq, these plots represents one representative replicate. c Real Time qPCR for androgen-responsive eRNA expression in LNCaP cells during starvation (EtOH) or 16 h of DHT treatment (DHT) of representative examples from AR active enhancers flanked by H2A.Zac-nucleosomes (AR with H2A.Zac, green background) or not flanked (AR w/o H2A.Zac, red background) (see Fig. 7b). Data is presented as the fold change in eRNA expression normalized to the expression level in EtOH condition (N = 3). d Real Time qPCR for androgen-responsive eRNA expression of representative eRNAs at AR enhancers flanked by H2A.Zac (KLK2 and KLK3 eRNAs, (Fig. 7b) in 3R cells during 16 h of DHT treatment (DHT) and daily Doxycycline (Dox) stimulation (+) or non stimulation (−). Data is shown as the fold change in eRNA expression normalized to the expression level in –Dox DHT condition (N = 2). e LNCaP cells were either untreated or treated (AA) with Anacardic Acid at 90 µM for 48 h (N = 2). eRNA expression levels of the AR-enhancer for KLK2 and KLK3 genes were measured by Real Time qPCR. Data are shown as the fold change in eRNA expression normalized to the expression level in the Untreated condition. For the eRNA Real time qPCR several primers were used per eRNA at regions around 200–1000 bp from the center of the AR binding site on the sense (S) or anti-sense strand (AS) (See Supplementary Table 4 for primer description). All error bars are shown as s.d
Fig. 9
Fig. 9
Proposed model for H2A.Zac-enhancer regulation in cancer and androgen signaling. a Proposed model of regulation of cancer –activated genes. In a normal context, these genes are silenced and their promoters and enhancers do not have H2A.Zac-containing nucleosomes (Silenced region). During transformation, these genes gain poised epigenetic marks that include a gain of H2A.Zac, loss of DNA methylation and gain of chromatin accessibility at both promoters and enhancers (Poised region). In prostate cancer these genes become activated by an increase of H2A.Zac and a change in its localization from the TSS and +1, +2 nucleosome to flank the TSS at promoters. H2A.Zac is also increased at enhancers and it changes from occupying to flank NDRs. These changes are also associated with a decrease in DNA methylation. b Proposed model for H2A.Zac remodeling during androgen signaling. Androgen-sensitive genes remain in a poised state during androgen deprivation (EtOH). This state is characterized by the presence of H2A.Zac nucleosomes at 60% of all the AR enhancer sites and H2A.Zac presence at the nucleosomes flanking the TSSs of all the androgen-sensitive genes. This subset of AR enhancer sites is also characterized by being more accessible. Upon AR activation through DHT treatment (2H, 4H, and 16H), H2A.Zac is removed/shifted to flank AR sites and allow AR binding. This is a very rapid process and occurs prior to gene activation and it is associated with a gain in chromatin accessibility at the AR enhancer sites. We also speculate that this remodeling facilitates the looping formation between gene promoters and AR-enhancers for gene activation

Comment in

References

    1. Kamakaka RT, Biggins S. Histone variants: deviants? Genes Dev. 2005;19:295–310. doi: 10.1101/gad.1272805. - DOI - PubMed
    1. Zlatanova J, Thakar A. H2A.Z: view from the top. Structure. 2008;16:166–179. doi: 10.1016/j.str.2007.12.008. - DOI - PubMed
    1. Sevilla A, Binda O. Post-translational modifications of the histone variant H2AZ. Stem Cell Res. 2014;12:289–295. doi: 10.1016/j.scr.2013.11.004. - DOI - PMC - PubMed
    1. Bruce K, et al. The replacement histone H2A.Z in a hyperacetylated form is a feature of active genes in the chicken. Nucleic Acids Res. 2005;33:5633–5639. doi: 10.1093/nar/gki874. - DOI - PMC - PubMed
    1. Valdes-Mora F, et al. Acetylation of H2A.Z is a key epigenetic modification associated with gene deregulation and epigenetic remodeling in cancer. Genome Res. 2012;22:307–321. doi: 10.1101/gr.118919.110. - DOI - PMC - PubMed

Publication types