

doi: 10.1093/neuonc/nox158.
CBTRUS Statistical Report: Primary brain and other central nervous system tumors diagnosed in the United States in 2010-2014
Affiliations
- PMID: 29117289
- PMCID: PMC5693142
- DOI: 10.1093/neuonc/nox158
Item in Clipboard
CBTRUS Statistical Report: Primary brain and other central nervous system tumors diagnosed in the United States in 2010-2014
Neuro Oncol.
.
No abstract available
Figures
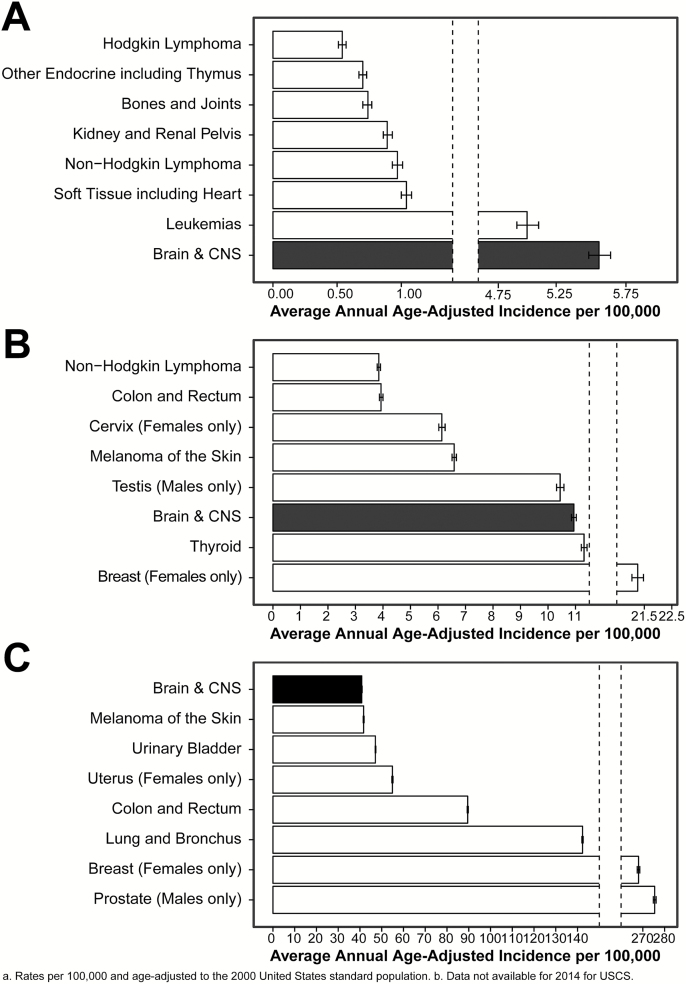
Annual average Age-Adjusted Incidence Ratesa of All Primary Brain and Other CNS Tumors in Comparison to Other Common Cancers for A. Children Age 0-14 Years, B. Adolescents and Young Adults Age 15-39 Years, and C. Older Adults Age 40+ Years, CBTRUS Statistical Report: NPCR and SEER 2010-2014, USCS 2010-2013b
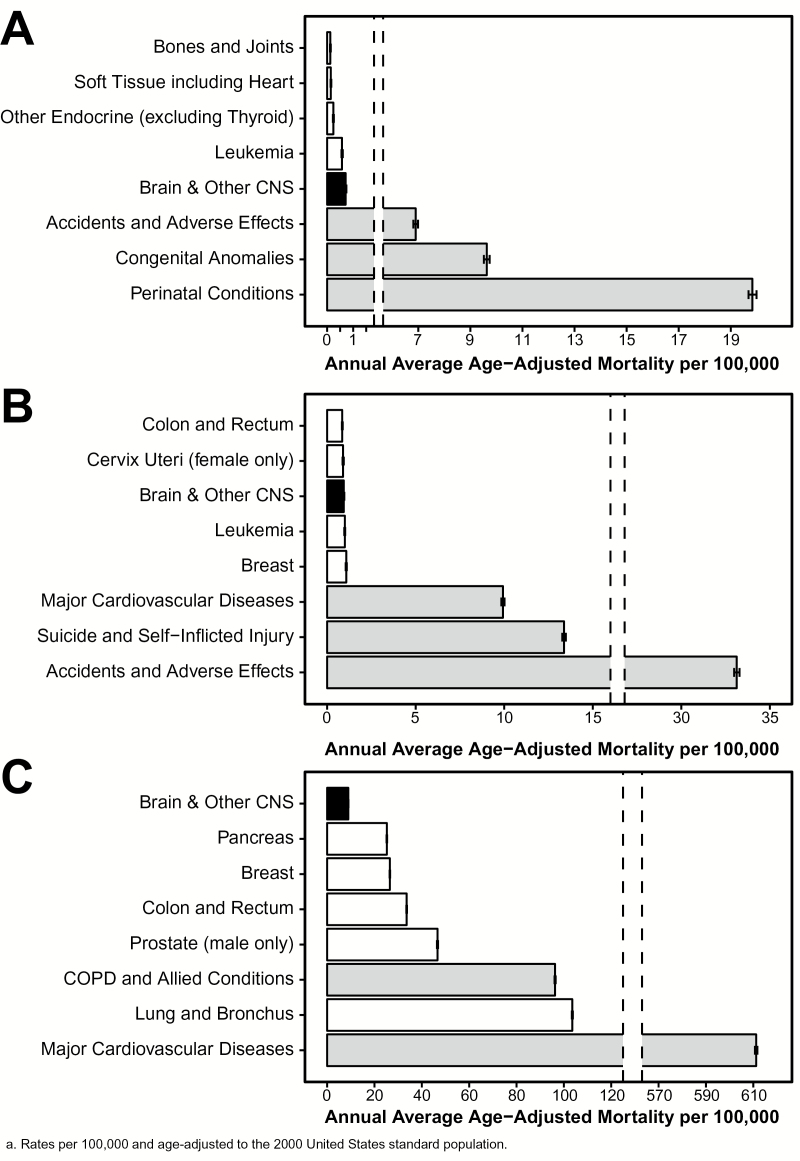
Annual average Age-Adjusted Mortality Ratesa of All Primary Brain and Other CNS Tumors in Comparison to Other Common Cancers and Top Three Non-Cancer Causes of Death for A. Children Age 0-14 Years, B. Adolescents and Young Adults Age 15-39 Years, and C. Older Adults Age 40+ Years, CBTRUS Statistical Report: NVSS 2010-2014
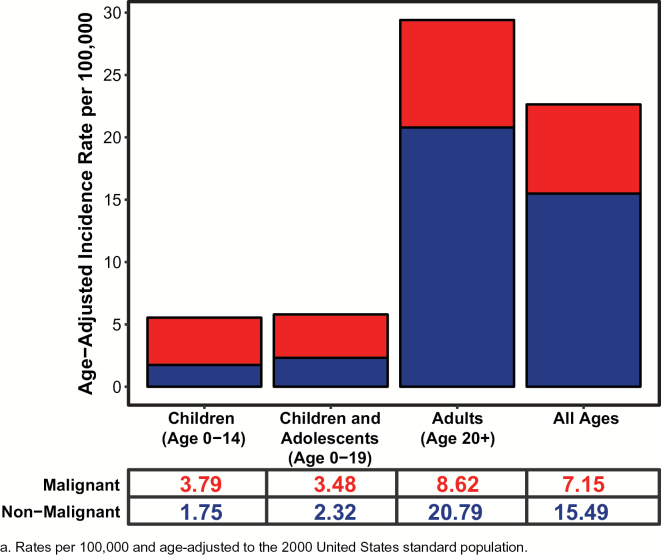
Annual average Age-Adjusted Incidence Ratesa of Primary Brain and Other CNS Tumors by Age and Behavior, CBTRUS Statistical Report: NPCR and SEER, 2010-2014
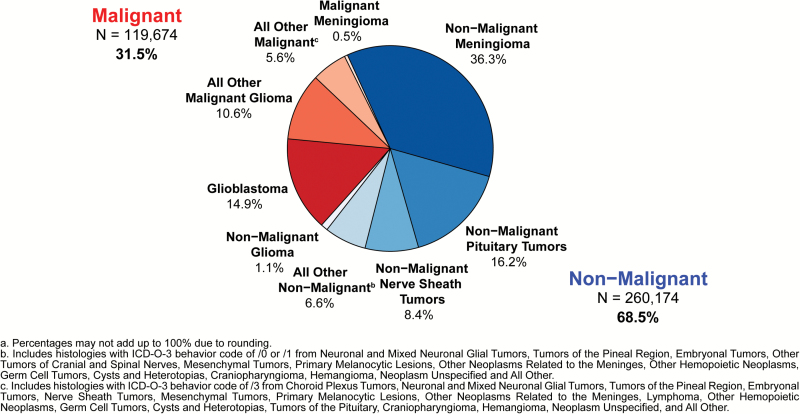
Distributiona of Primary Brain and Other CNS Tumors by Behavior (N=379,848), CBTRUS Statistical Report: NPCR and SEER, 2010-2014
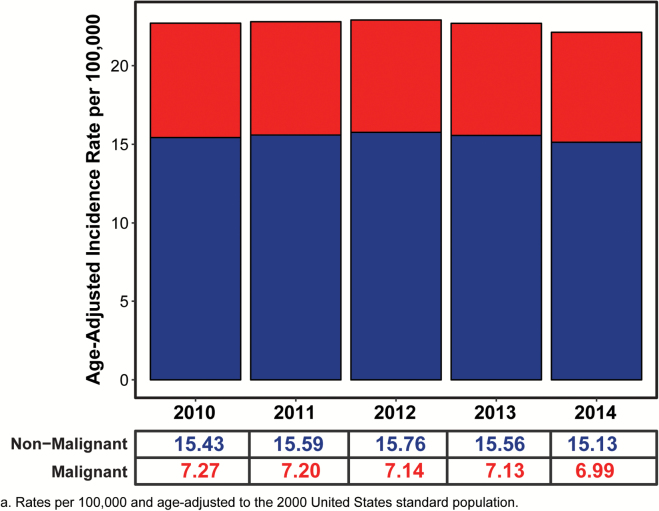
Annual Age-Adjusted Incidence Ratesa of Primary Brain and Other CNS Tumors by Year and Behavior, CBTRUS Statistical Report: NPCR and SEER, 2010-2014
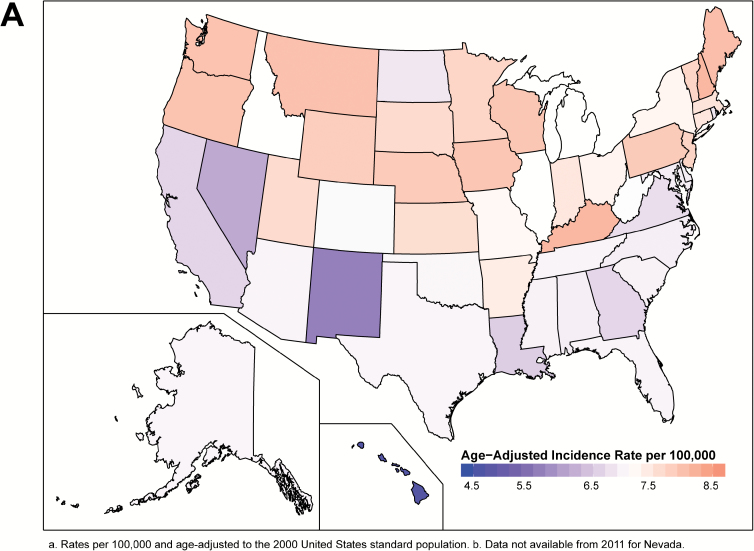
Annual average Age-Adjusted Incidence Ratesa of A. Malignant Primary Brain and Other CNS Tumors by Central Cancer Registry, and B. Non-Malignant Primary Brain and Other CNS Tumors by Central Cancer Registry, CBTRUS Statistical Report: NPCR and SEER, 2010-2014b
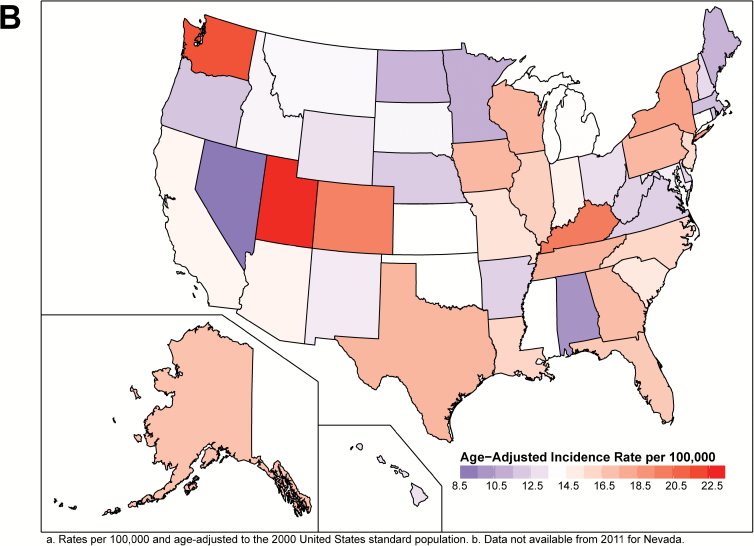
Annual average Age-Adjusted Incidence Ratesa of A. Malignant Primary Brain and Other CNS Tumors by Central Cancer Registry, and B. Non-Malignant Primary Brain and Other CNS Tumors by Central Cancer Registry, CBTRUS Statistical Report: NPCR and SEER, 2010-2014b
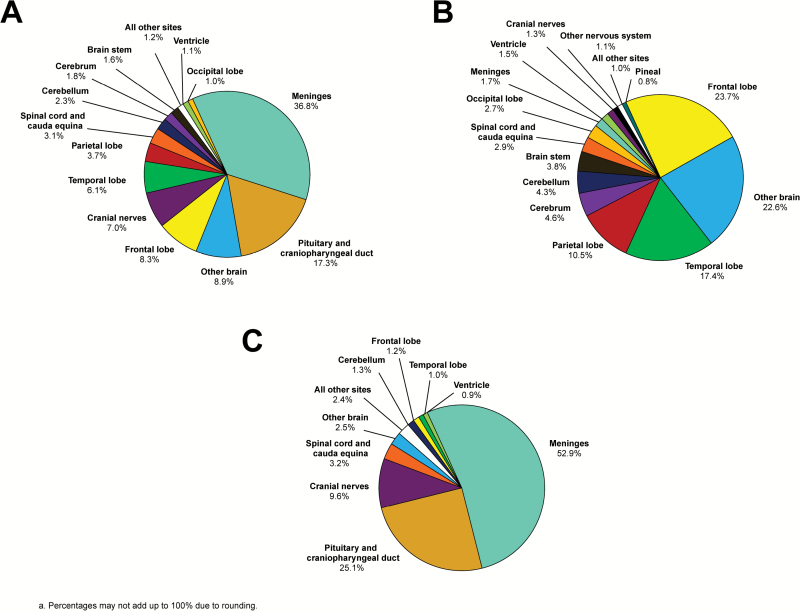
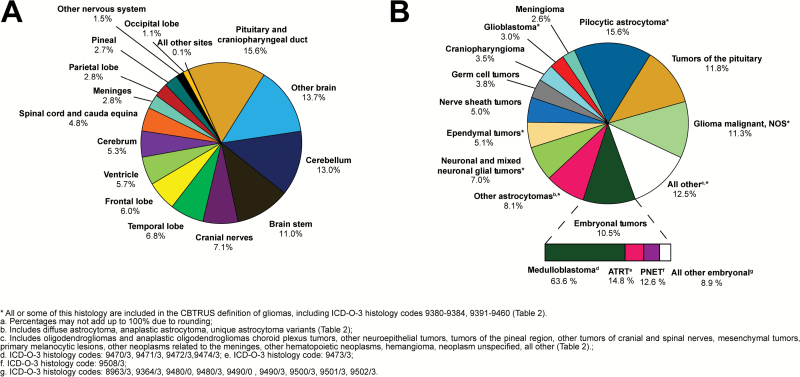
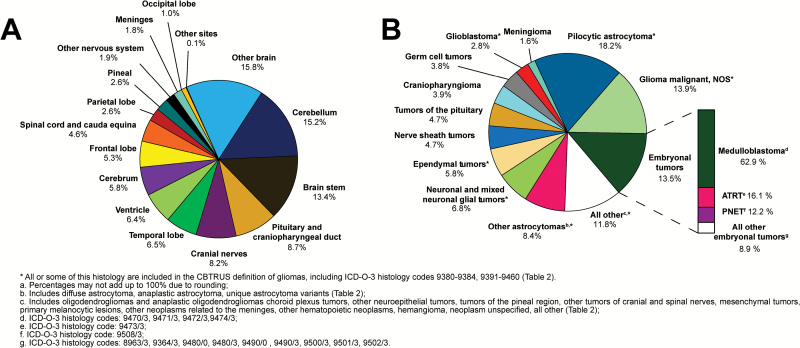
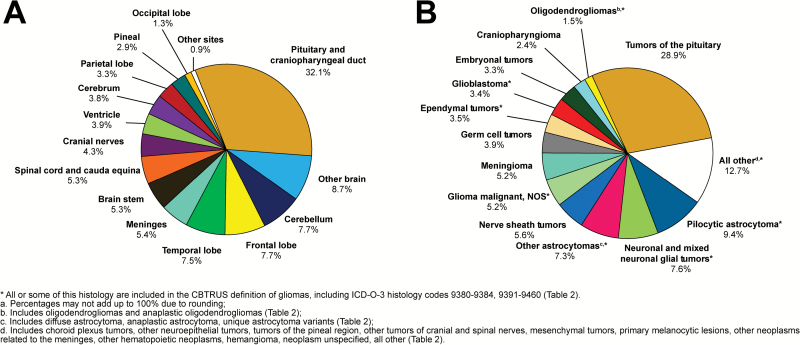
Distributiona of A. All Primary Brain and Other CNS Tumors by Site (N=379,848), B. Malignant Primary Brain and Other CNS Tumors by Site (N=119,674), and C. Non-Malignant Primary Brain and Other CNS Tumors by Site (N=260,174), CBTRUS Statistical Report: NPCR and SEER, 2010-2014
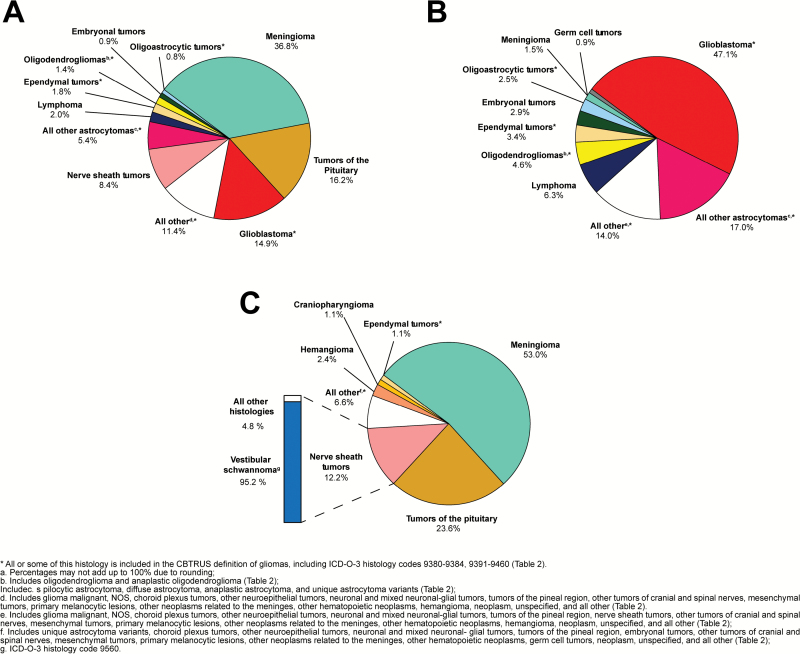
Distributiona of A. All Primary Brain and Other CNS Tumors by CBTRUS Histology Groupings and Histology (N=379,848), B. Malignant Primary Brain and Other CNS Tumors by CBTRUS Histology Groupings and Histology (N=119,674), and C. Non-Malignant Primary Brain and Other CNS Tumors by CBTRUS Histology Groupings and Histology (N=260,174), CBTRUS Statistical Report: NPCR and SEER, 2010-2014
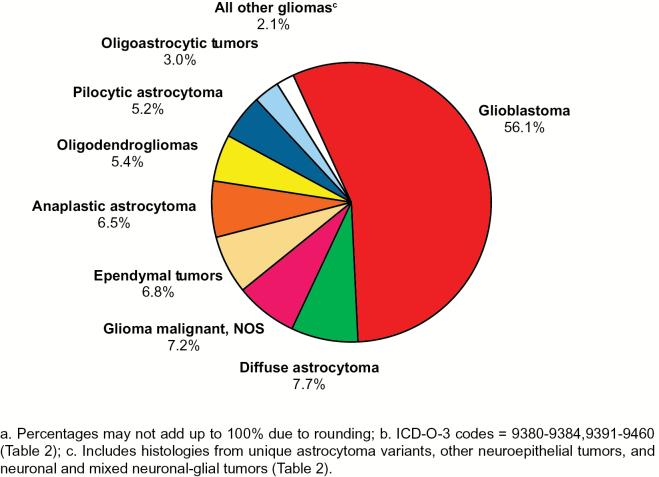
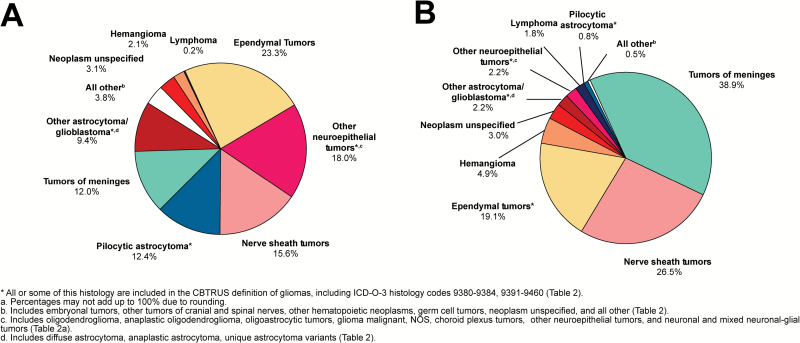
Distributiona of Primary Brain and Other CNS Gliomasb by Histology Subtypes (N=100,619), CBTRUS Statistical Report: NPCR and SEER, 2010-2014
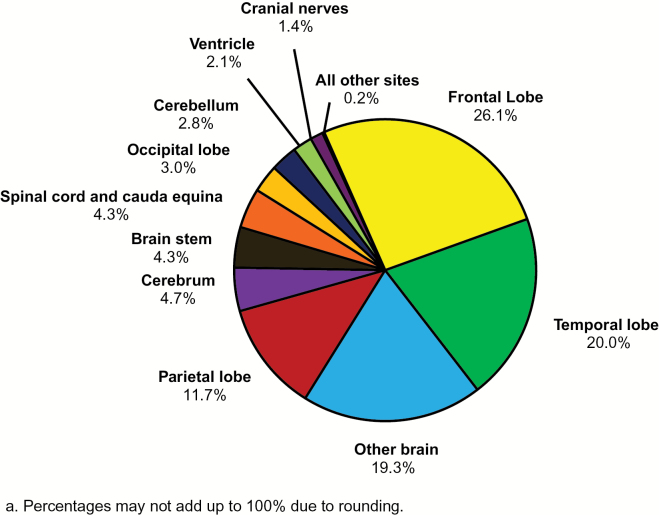
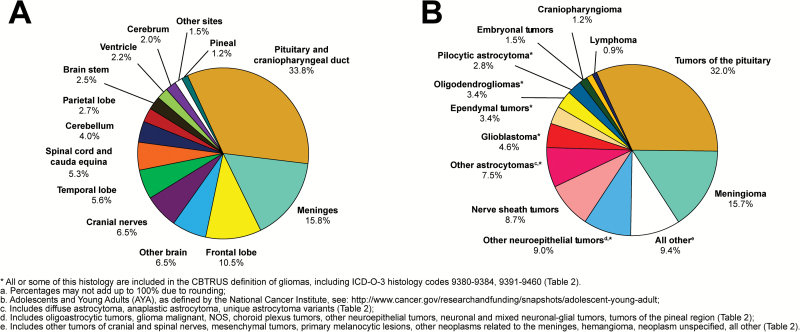
Distribution of Primary Brain and Other CNS Gliomasa by Site (N=100,619), CBTRUS Statistical Report: NPCR and SEER, 2010-2014
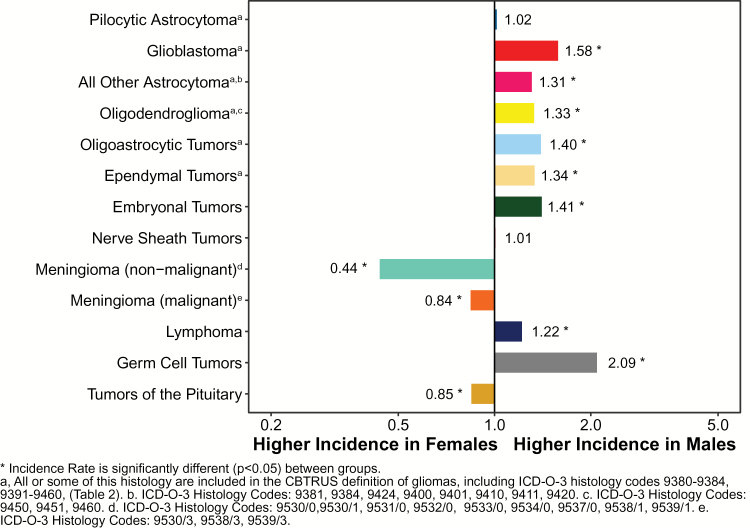
Incidence Rate Ratios of Brain and Other CNS Tumors by Sex (Males:Females) for Selected CBTRUS Histology Groupings and Histology, CBTRUS Statistical Report: NPCR and SEER, 2010-2014
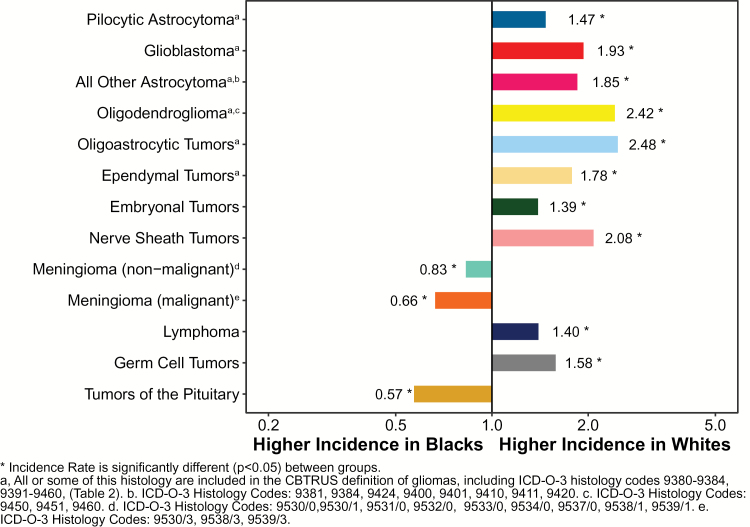
Incidence Rate Ratios of Brain and Other CNS Tumors by Race (Whites:Blacks) for Selected CBTRUS Histology Groupings and Histologies, CBTRUS Statistical Report: NPCR and SEER, 2010-2014
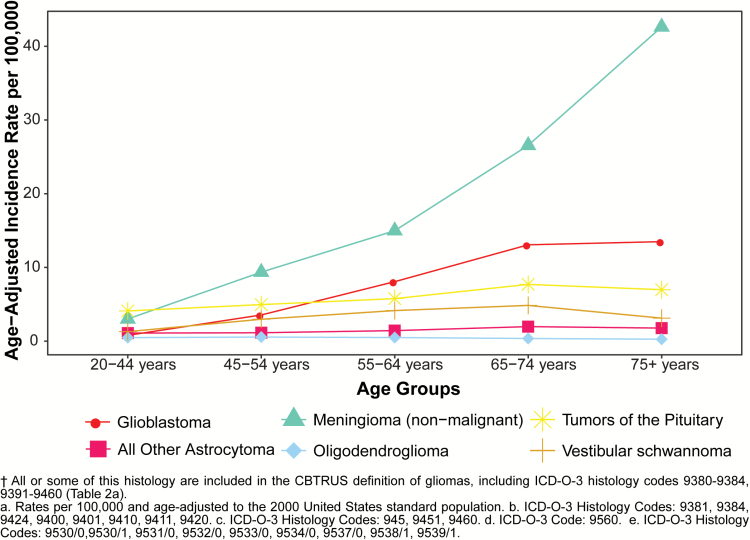
Age-Adjusted Incidence Ratesa of Brain and Other CNS Tumors by Selected Histologies and Age-Group (Age 20+ Years), CBTRUS Statistical Report: NPCR and SEER, 2010-2014
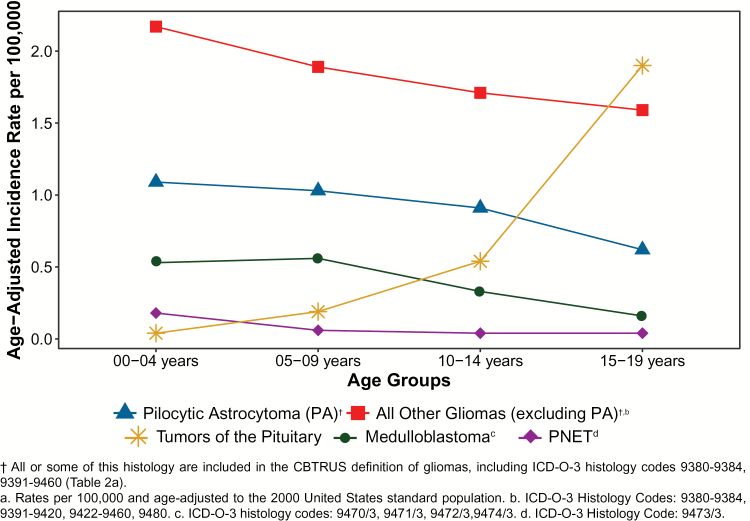
Age-Adjusted Incidence Ratesa of Brain and Other CNS Tumors in Children and Adolescents by Selected Histologies and Age-Group (Age 0-19 Years), CBTRUS Statistical Report: NPCR and SEER, 2010-2014
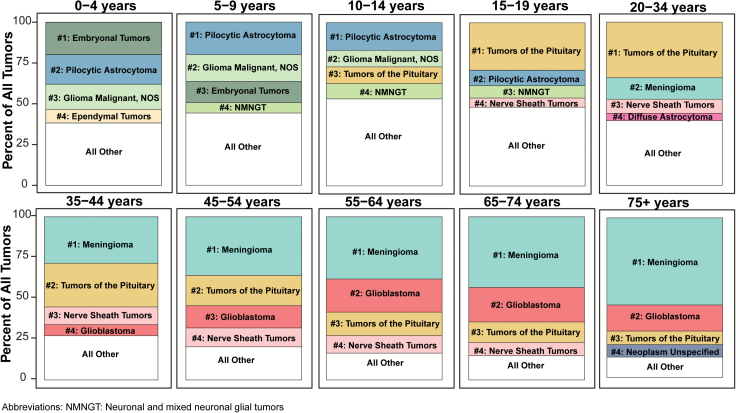
Most Common Primary Brain and Other Central Nervous System Tumors by Age-Group, CBTRUS Statistical Report: NPCR and SEER, 2010-2014
Distributiona in Children and Adolescents (Age 0-19 Years) of Primary Brain and CNS Tumors by A. Site (N=21,002), and B. CBTRUS Histology Groupings and Histology (N= 21,002), CBTRUS Statistical Report: NPCR and SEER, 2010-2014
Distributiona in Children (Age 0-14 Years) of Primary Brain and Other CNS Tumors by A. Site (N=16,941), and B. CBTRUS Histology Groupings and Histology (N=16,941), CBTRUS Statistical Report: NPCR and SEER, 2010-2014
Distributiona in Adolescentsb (Age 15-19 Years) of Primary Brain and Other CNS Tumors by A. Site (N=7,061), and B. Histology (N=7,061), CBTRUS Statistical Report: NPCR and SEER, 2010-2014
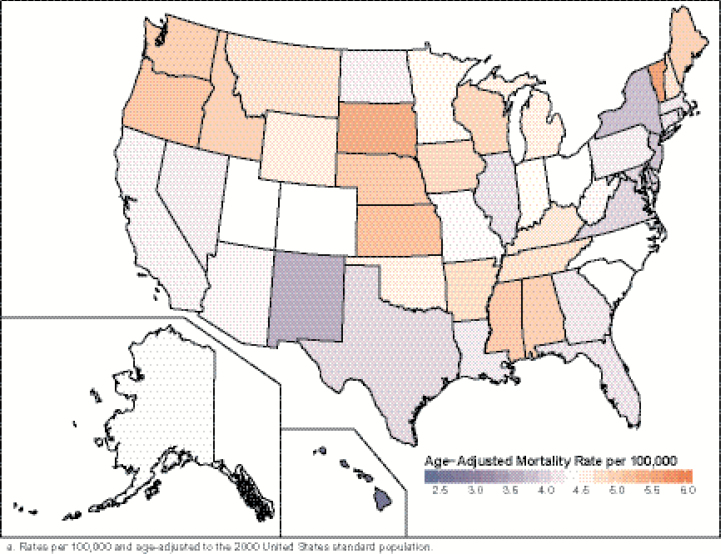
Annual Average Age-Adjusted Mortality Ratesa for Malignant Primary Brain and Other CNS Tumors by Central Cancer Registry, CBTRUS Statistical Report: NCHS, 2010-2014
Distributiona of Primary Spinal Cord, Spinal Meninges, and Cauda Equina Tumors in A. Children and Adolescents (Age 0-19 Years), and B. Adults (Age 20+ Years), CBTRUS Histology Groupings and Histology (N=16,588) CBTRUS Statistical Report: NPCR and SEER, 2010-2014
Distributiona in Adolescents and Young Adultsb (Age 15-39 Years) of Primary Brain and Other CNS Tumors by A. Site (N=56,039), and B. Histology (N=56,039), CBTRUS Statistical Report: NPCR and SEER, 2010-2014
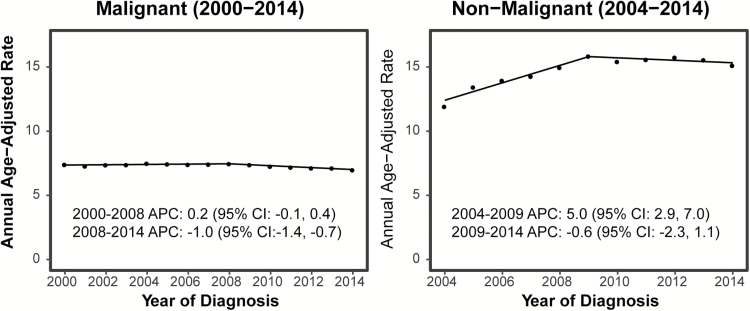
Annual Age-Adjusted Incidence Rates of Primary Brain and Other CNS Tumors, and Incidence Trends by Behavior, CBTRUS Statistical Report: NPCR and SEER, 2000-2014 (varying)
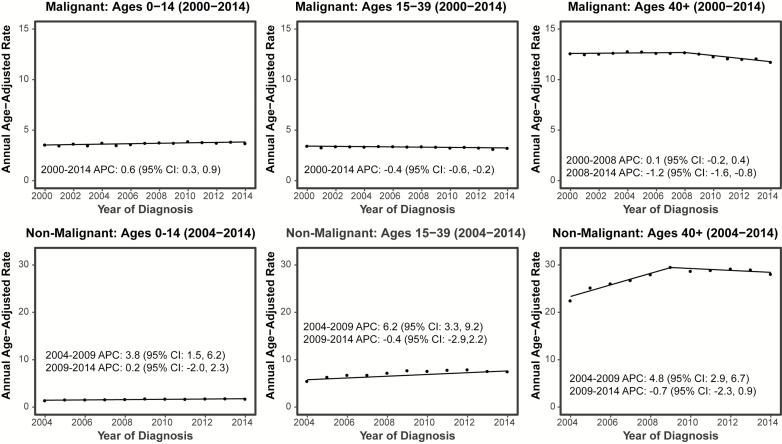
Annual Age-Adjusted Incidence Rates of Primary Brain and Other CNS Tumors, and Incidence Trends by Behavior and Age-Group, CBTRUS Statistical Report: NPCR and SEER, 2000-2014 (varying)
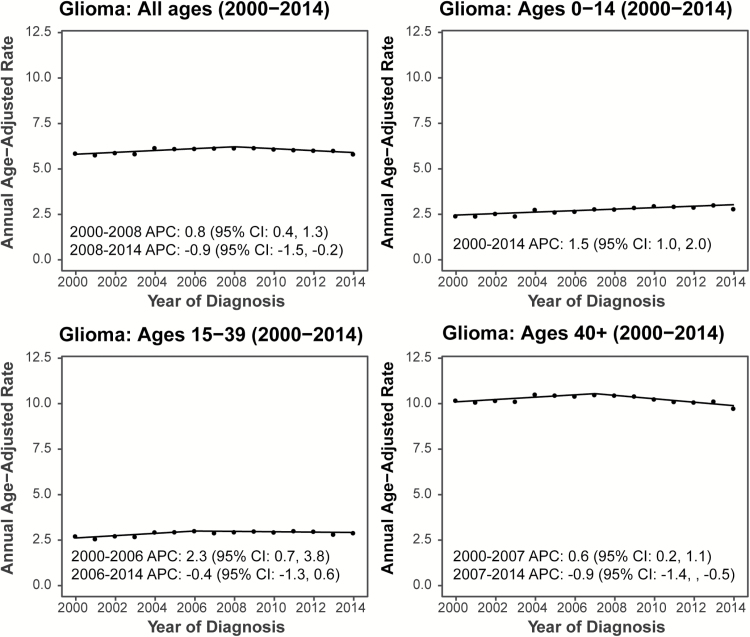
Annual Age-Adjusted Incidence Rates of Primary Brain and Other CNS Gliomas, and Incidence Trends by Age-Group, CBTRUS Statistical Report: NPCR and SEER, 2000-2014
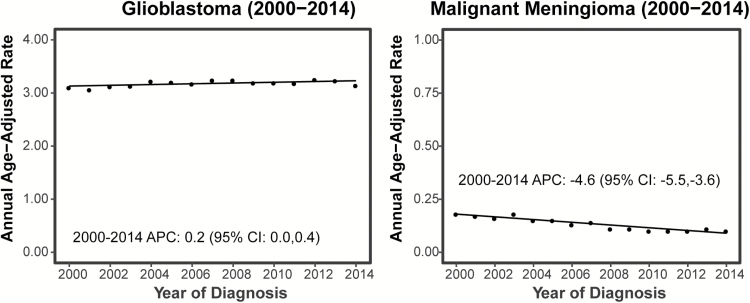
Annual Age-Adjusted Incidence Rates of Selected Malignant Primary Brain and Other CNS Tumors, and Incidence Trends by Histology, CBTRUS Statistical Report: NPCR and SEER, 2004-2014
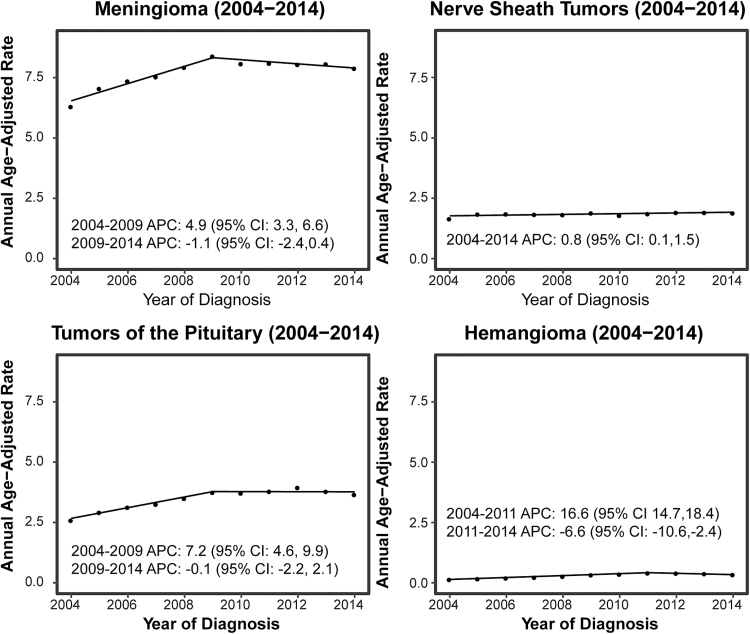
Annual Age-Adjusted Incidence Rates of Selected Non-Malignant Primary Brain and Other CNS Tumors, and Incidence Trends by Histology, CBTRUS Statistical Report: NPCR and SEER, 2000-2014
References
-
- Louis D, Wiestler O, Cavanee W, eds. WHO Classification of Tumours of the Central Nervous System. Lyon, France: International Agency for Research on Cancer; 2007.
-
- Centers for Disease Control and Prevention (CDC). National Program of Cancer Registries Cancer Surveillance System Rationale and Approach 1999; http://www.cdc.gov/cancer/npcr/pdf/npcr_css.pdf.
-
- Wiśniewski JR, Zougman A, Nagaraj N, Mann M. Universal sample preparation method for proteome analysis. Nat Methods. 2009;6(5):359–362. - PubMed
-
- Benign Brain Tumor Cancer Registries Amendment Act, 107th Cong. § 260 (2002) http://www.gpo.gov/fdsys/pkg/PLAW-107publ260/pdf/PLAW-107publ260.pdf.
