. 2017 Nov 6;216(suppl_7):S733-S739.
doi: 10.1093/infdis/jix380.

Delivering Patient-Centered Care in a Fragile State: Using Patient-Pathway Analysis to Understand Tuberculosis-Related Care Seeking in Pakistan

Affiliations

Delivering Patient-Centered Care in a Fragile State: Using Patient-Pathway Analysis to Understand Tuberculosis-Related Care Seeking in Pakistan

Razia Fatima et al. J Infect Dis. .

Abstract

Background: Pakistan has the sixth largest population in the world and boasts the fifth greatest burden of tuberculosis. The Government of Pakistan has set the ambitious goal of zero deaths due to tuberculosis and universal access to tuberculosis care by 2020. Successfully reaching these goals is dependent on the country's capacity to diagnose and successfully treat an estimated 200000 unnotified or missing patients with tuberculosis.

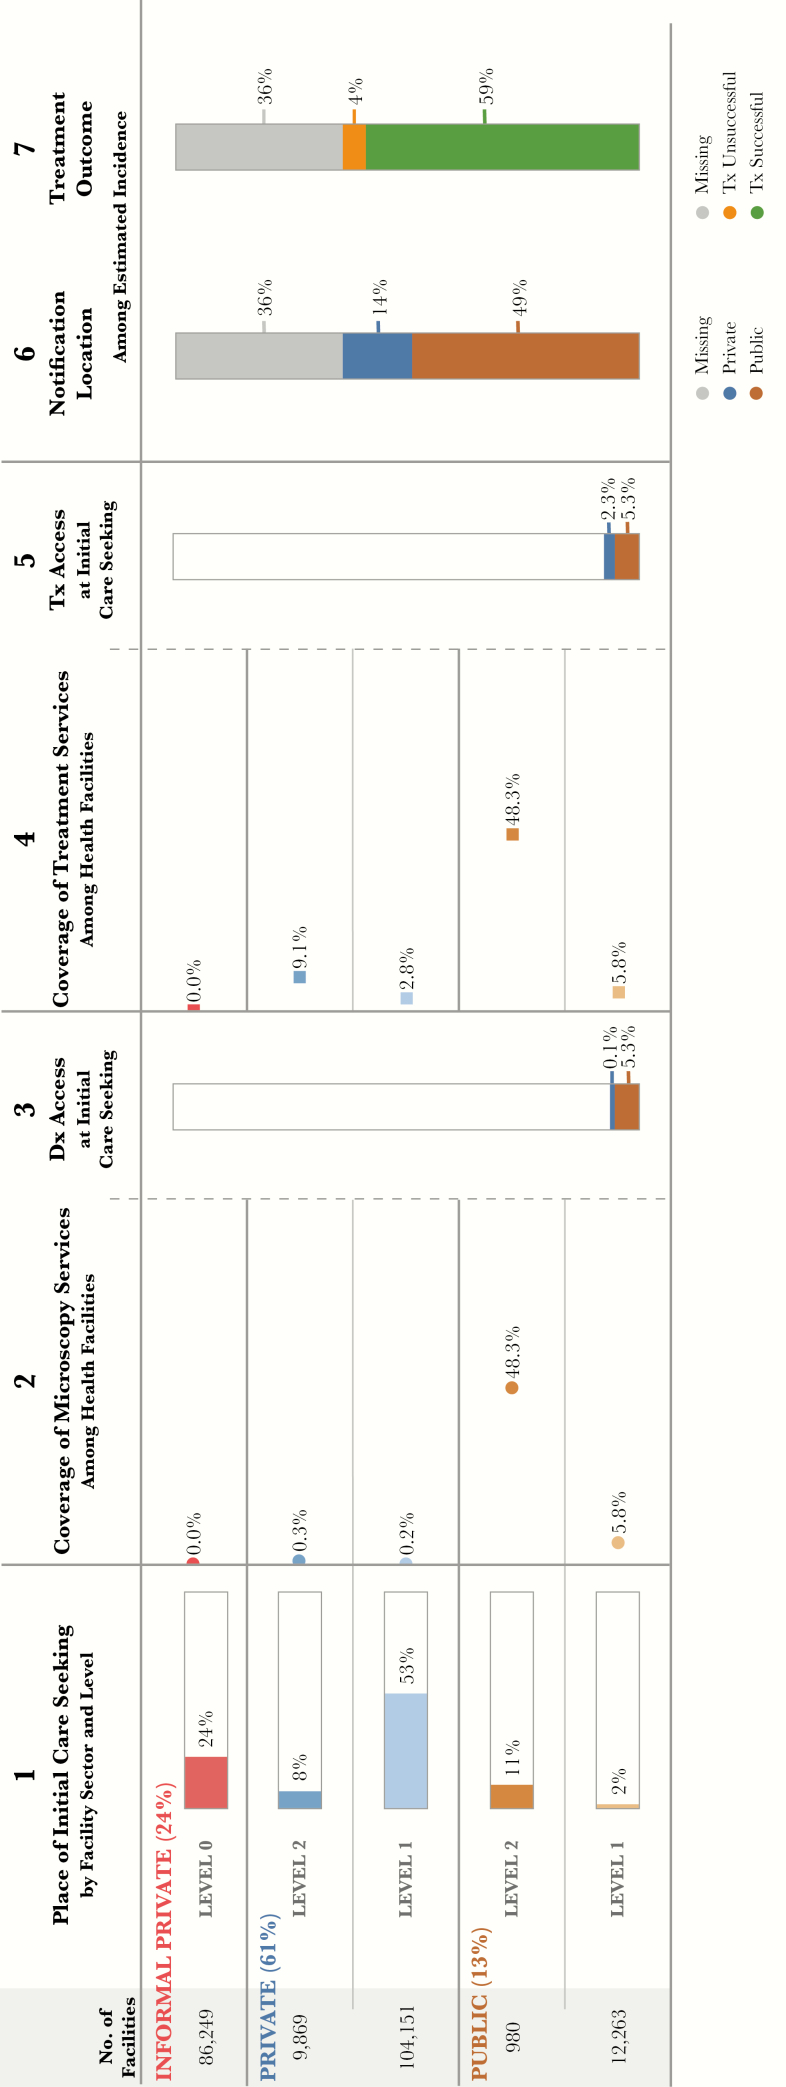
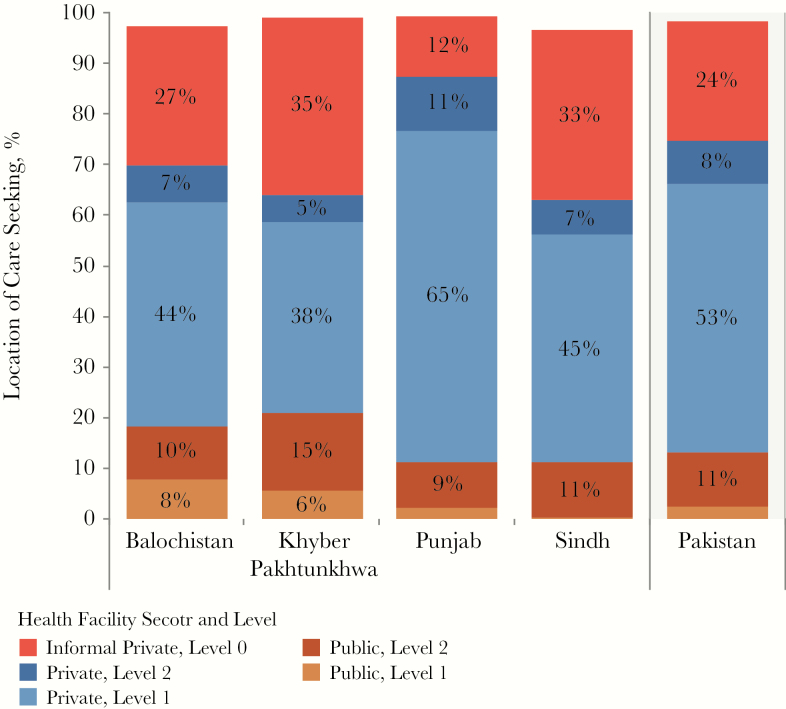
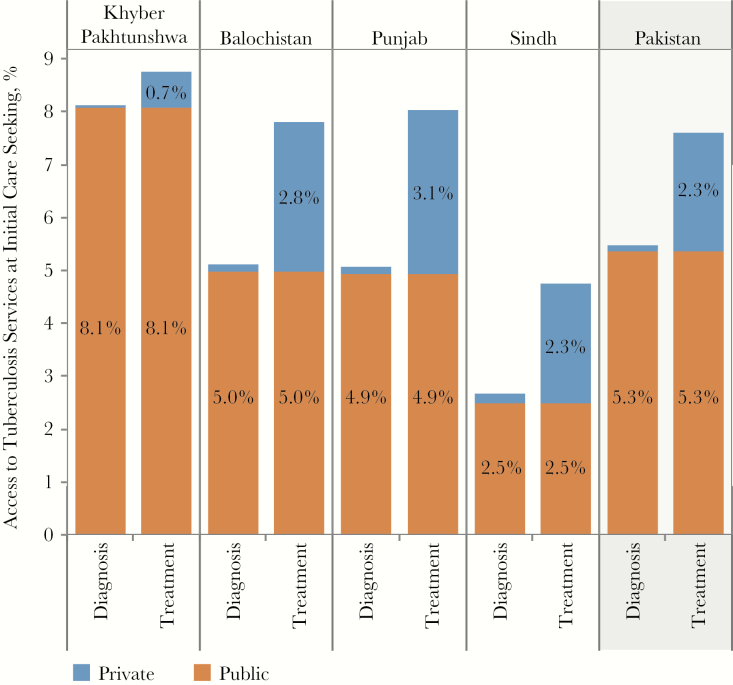
Methods: A patient-pathway analysis (PPA) was conducted at the national level, as well as for each of the 4 provinces, to assess the alignment between patient care seeking and the availability of tuberculosis diagnostic and treatment services.

Results: Almost 90% of patients initiated care in the private sector, which accounts for only 15% of facilities with the capacity for tuberculosis diagnosis and treatment. Across the country, nearly 50% of tuberculosis microscopy laboratories were located in public-sector-basic health units and regional health centers. However, very few patients initiated care in these facilities. Overall, tuberculosis case detection was high given the low likelihood of patients reaching facilities with the capacity for tuberculosis service delivery during their first visit.

Discussion: Improving the engagement of the informal sector and lower-level clinicians will improve the efficiency and timeliness of tuberculosis diagnosis for patients in Pakistan. Concurrently, the apparent strength of the referral networks connecting community-level workers and private clinicians to the public sector for tuberculosis diagnosis and treatment suggests that strengthening the capacity of the public sector could be valuable.

Keywords: Tuberculosis; care seeking; case notification; diagnostic; patient-pathway analysis; private; public.


Figures

Figure 1.
Figure 1.
Patient-pathway visual at the national level. The patient pathway describes the care-seeking patterns of patients and how those patients might intersect with tuberculosis services. Column 1 first shows the sectors and levels of the health system (sectors and levels where no data were available are not included in the pathway). The percentage next to each sector title shows the share of patients who initiate care seeking in this sector [14]. Next are the reported numbers of health facilities at each sector and level [14, 15]. The final part of column 1 shows the percentage of patients at each sector and level who visited a health facility during the 4 weeks before a national health accounts out-of-pocket expenditure survey in 2011–2012 [14]. Column 2 shows the percentage of health facilities that have microscopy across each sector and level of the health system. Coverage in column 2 was calculated using the number of health facilities in column 1 as the denominator and, as the numerator, a list of health facilities with tuberculosis services (microscopy and treatment) provided by the national tuberculosis program. This list included both public and private facilities [16]. Column 3 shows the estimated percentage of patients likely to access a facility with tuberculosis diagnosis available on their first visit to a healthcare facility. This column was calculated by multiplying the share of care seeking at each sector/level of the health system by the coverage of microscopy at each respective sector/level and summing the total. Columns 3 and 5 separate public and private sectors on the basis of each sector’s contribution to tuberculosis services access at initial care seeking. Column 4 shows the percentage of health facilities that have tuberculosis treatment available at each sector and level of the health system. Coverage of treatment services was calculated using the same data from column 2 [16]. In addition, the National Tuberculosis Program maintains an additional list of private facilities that are engaged to provide tuberculosis treatment services as part of public-private mix programs. This list was included as part of the treatment coverage calculations for private-sector facilities. Column 5 shows the estimated percentage of patients accessing a facility with tuberculosis treatment available on their initial visit to a healthcare facility. This column was calculated by multiplying the share of care seeking at each sector/level of the health system by the coverage of treatment at each respective sector/level and summing the total. Column 6 shows which sector provided case notification, and values are calculated as a share of the overall estimated incidence in 2015 [7]. Column 7 shows the treatment outcome of notified cases among the overall estimated incidence for 2015 [7]. Columns may not sum to 100%, owing to rounding. For more details on the data sources used in the pathway, see the Supplementary Materials.
Figure 2.
Figure 2.
Care-seeking patterns, by province, for patients who visited a health facility during the 4 weeks before the health utilization survey conducted as part of the 2011–2012 National Health Accounts [14]. Responses from this survey were categorized using the standard health sector and level categorization described elsewhere in this article. Responses were available at the national level and for 4 provinces and were used in the patient-pathway analysis for each province (column 1, Figure 1). Percentages in columns might not sum to 100% because care-seeking data for facilities classified as “other” were excluded.
Figure 3.
Figure 3.
Access to diagnosis and treatment at initial care seeking, by province. The patient-pathway analysis was completed at the national level, as well as subnationally for 4 provinces. The figure shows the access to diagnosis and treatment at initial care-seeking metrics across each of these provinces (columns 3 and 5, Figure 1).

References

    1. World Bank. Population, total. 2015 http://data.worldbank.org/indicator/SP.POP.TOTL?locations=PK&year_high_d.... Accessed 7 May 2017.
    1. World Bank. Rural population (% of total population). 2015 http://data.worldbank.org/indicator/SP.RUR.TOTL.ZS?locations=PK.
    1. Fund for Peace. Fragile states index 2016 http://reliefweb.int/report/world/fragile-states-index-2016.
    1. Ministry of National Health Services Regulations and Coordination. Pakistan 2025: one nation–one vision 2014. http://fics.seecs.edu.pk/Vision/Vision-2025/Pakistan-Vision-2025.pdf.
    1. Institute for Health Metrics and Evaluation. Pakistan. 2015 http://www.healthdata.org/pakistan. Accessed 7 May 2017.

Publication types