Review
. 2017 Nov 6;216(suppl_7):S686-S695.
doi: 10.1093/infdis/jix388.

Finding the Missing Patients With Tuberculosis: Lessons Learned From Patient-Pathway Analyses in 5 Countries

Affiliations
Review

Finding the Missing Patients With Tuberculosis: Lessons Learned From Patient-Pathway Analyses in 5 Countries

Christy Hanson et al. J Infect Dis. .

Abstract

Background: Despite significant progress in diagnosis and treatment of tuberculosis over the past 2 decades, millions of patients with tuberculosis go unreported every year. The patient-pathway analysis (PPA) is designed to assess the alignment between tuberculosis care-seeking patterns and the availability of tuberculosis services. The PPA can help programs understand where they might find the missing patients with tuberculosis.

Methods: This analysis aggregates and compares the PPAs from case studies in Kenya, Ethiopia, Indonesia, the Philippines, and Pakistan.

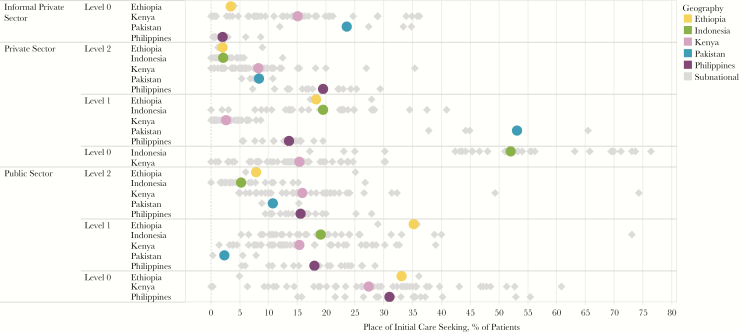
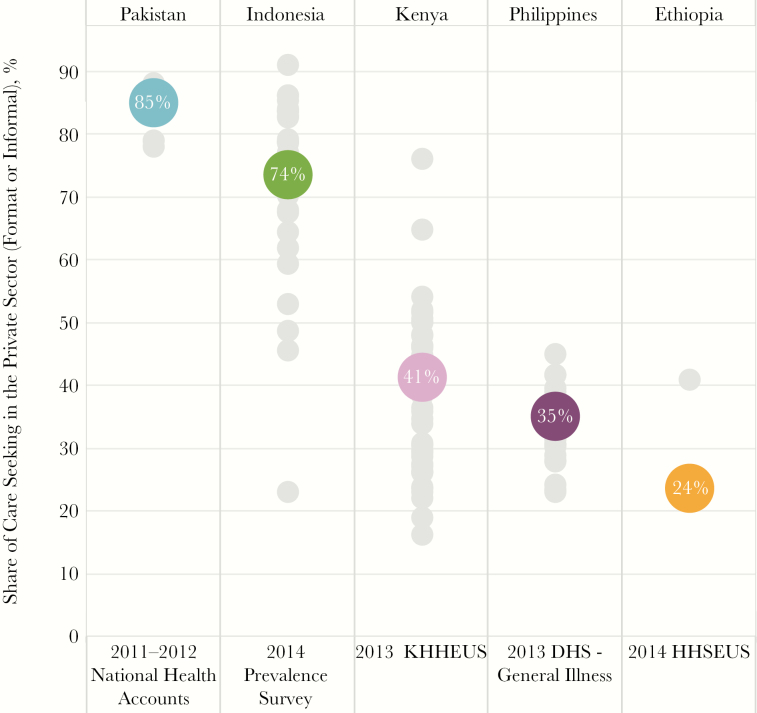
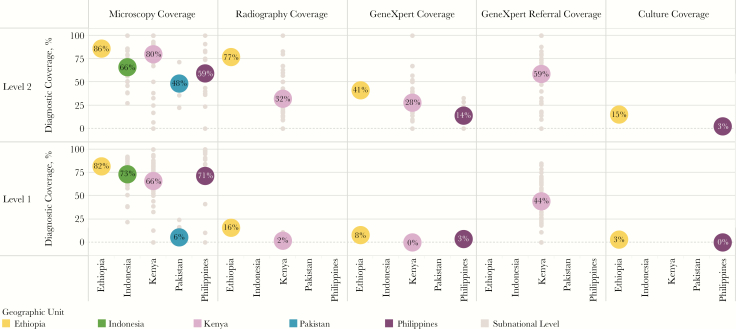
Results: Across the 5 countries, 24% of patients with tuberculosis initiated care seeking in a facility with tuberculosis diagnostic capacity. Forty-two percent of patients sought care at level 0 facilities, where there was generally no tuberculosis diagnostic capacity; another 42% of patients sought care at level 1 facilities, of which 39% had diagnostic capacity. Sixty-six percent of patients initially sought care in private facilities, which had considerably less tuberculosis diagnostic capacity than public facilities; only 7% of notified cases were from the private sector. The GeneXpert system was available in 14%-41% of level 2 facilities in the 3 countries for which there were data. Tuberculosis treatment capacity tracked closely with the availability of diagnostic capacity. There were substantial subnational differences in care-seeking patterns and service availability.

Discussion: The PPA can be a valuable planning and programming tool to ensure that diagnostic and treatment services are available to patients where they seek care. Patient-centered care will require closing the diagnostic gap and engaging the private sector. Extensive subnational differences in patient pathways to care call for differentiated approaches to patient-centered care.

Keywords: Tuberculosis; care seeking; patient-pathway analysis; private sector.


Figures

Figure 1.
Figure 1.
Patient-pathway visual—5-country summary. The 5-country patient-pathway visual combines data from 5 of the country profiles included in the accompanying supplement (Ethiopia, Indonesia, Kenya, Pakistan, and the Philippines). Column 1 of the pathway shows cumulatively the place of initial care seeking across all 5 countries. This was calculated by multiplying data on initial care seeking in each country at the respective sectors and levels by the estimated incidence of tuberculosis in that country. The resulting care-seeking values were then summed across country, sector, and level to estimate approximate care-seeking patterns for all 5 countries. Columns 2 and 4—diagnostic and treatment coverage—were calculated using the average coverage among countries with available data. Only data on microscopy and treatment provision were used for this summary pathway, because these were the data points most widely available across all 5 countries. In cases where data was missing for any country, coverage was averaged across the remaining country data points, with the exception of L0 facilities (all sectors), for which microscopy and treatment coverage was assumed to be 0% in countries without data. Columns 3 and 5 were calculated by multiplying the share of care seeking at each sector and level by the average coverage of diagnosis and treatment services, respectively, at each sector and level. The results were then aggregated across public and private sectors to provide estimates of the percentage of patients likely to access diagnosis and treatment on their initial visit to a healthcare facility. Column 6 shows the location of case notification for cases notified to the World Health Organization (WHO). Notification location is calculated among the total estimated burden of the 5 countries profiled, and nonnotified cases are labeled as “missing.” Column 7 shows treatment outcomes among patients notified to the WHO. Treatment success rates from the 2016 WHO report for each country were evaluated with respect to their notified cases to calculate the number of patients who did and those who did not successfully complete treatment. These numbers were then calculated among the total estimated burden of the 5 countries profiled, with nonnotified cases labeled as “missing.”
Figure 2.
Figure 2.
Care-seeking patterns across countries. Care-seeking patterns are diverse across countries, requiring programs tailored to the sectors and levels accessed by patients. Subnational care-seeking patterns (gray diamonds) show wide disparities within countries.
Figure 3.
Figure 3.
Private-sector care-seeking patterns. Private-sector healthcare facilities play an important role across all countries. This visual shows the share of patients seeking care in either formal or informal private-sector care facilities. At the national level (colored circles), 74% of patients in Indonesia and 85% of patients in Pakistan initiate care seeking in the private sector. However, private sector care-seeking patterns at sub-national levels (gray circles) in countries such as Indonesia (range, 23%–91%) and Kenya (range, 16%–76%) vary widely. Abbreviations: HHSEUS, Household Health Services Utilization Expenditure Survey; KHHEUS, Kenya Household Health Expenditure and Utilisation Survey.
Figure 4.
Figure 4.
Comparison of subnational pathways in 2 provinces in the Philippines. When the patient pathway is completed at the subnational level, it can highlight important differences in care seeking and service alignment patterns of national tuberculosis programs. This visual highlights 2 regions in the Philippines with important differences in the alignment of care-seeking patterns and service coverage. The top visual shows Cagayan Valley (Region II), which has relatively uniform care seeking across the 3 levels of the public-sector healthcare system. Owing to the high coverage by diagnostic tools at levels 1 and 2, >50% of patients are likely to access diagnosis on their first visit to a health facility (column 3). The bottom visual shows the pathway for Zamboanga Peninsula (Region IX). In this region, more than half of patients initiate care seeking at level 0 public sector facilities, where coverage by tuberculosis diagnostic tools is not available. Thus, these patients are reliant on a referral system to receive a diagnosis for tuberculosis. Owing to the higher share of patients seeking care where diagnostic tools are not available, the access to diagnosis at initial care seeking metric (column 3) is much lower in Region IX. Abbreviations: DOTS, directly observed therapy, short course; DST, drug-susceptibility testing; iDOTS, integrated directly observed therapy, short course; LED-FM, light-emitting diode fluorescence microscopy; NA, not available; STC, satellite treatment center; TC, treatment center. aThe National Health Facility Registry does not provide reliable data on the number of health facilities in private-sector level 1 facilities.
Figure 5.
Figure 5.
Diagnostic coverage among public sector primary care facilities and hospitals. This visual compares the coverage of diagnostic services among public sector level 1 (primary care) and level 2 (hospitals) health facilities. Colored circles indicate coverage of diagnostic tools at the national level, and gray circles indicate coverage in respective subnational levels (eg, regions in the Philippines, provinces in Indonesia and Pakistan, and counties in Kenya).

References

    1. United Nations Millennium Project. Goals, targets, and indicators 2000. http://www.unmillenniumproject.org/goals/gti.htm. Accessed 2 June 2017.
    1. World Health Organization. Global tuberculosis Report 2016. http://www.who.int/tb/publications/global_report/en/. Accessed 2 June 2017.
    1. World Health Organization. Global Health Observatory (GHO) data for tuberculosis 2015. http://www.who.int/gho/tb/en/. Accessed 2 June 2017.
    1. United Nations. Sustainable Development Goals: Goal 3 2015. http://www.un.org/sustainabledevelopment/health/. Accessed 2 June 2017.
    1. World Health Organization. The top 10 causes of death 2015. http://www.who.int/mediacentre/factsheets/fs310/en/. Accessed 2 June 2017.

Publication types

MeSH terms