. 2017 Nov 6;216(suppl_7):S740-S747.
doi: 10.1093/infdis/jix391.

Using Patient Pathway Analysis to Design Patient-centered Referral Networks for Diagnosis and Treatment of Tuberculosis: The Case of the Philippines

Affiliations

Using Patient Pathway Analysis to Design Patient-centered Referral Networks for Diagnosis and Treatment of Tuberculosis: The Case of the Philippines

Celine Garfin et al. J Infect Dis. .

Abstract

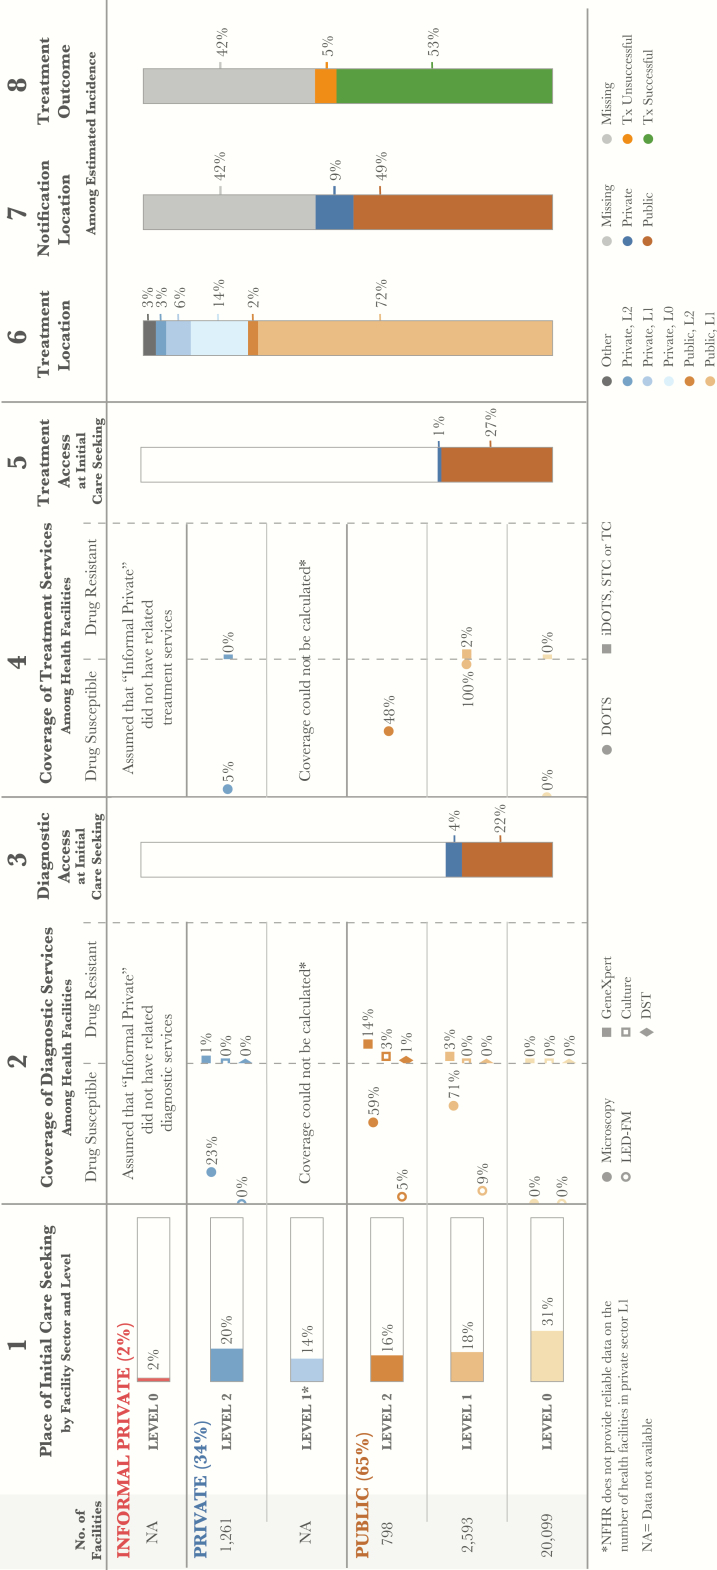
Background: Tuberculosis (TB) is the 8th leading cause of death in the Philippines. A recent prevalence survey found that there were nearly 70% more cases of tuberculosis than previously estimated. Given these new data, the National TB Program (NTP), operating through a decentralized health system, identified about 58% of the estimated new drug-sensitive (DS) TB patients in 2016. However, the NTP only identified and commenced treatment for around 17% of estimated new drug-resistant patients. In order to reach the remaining 42% of drug-sensitive patients and 83% of drug-resistant patients, it is necessary to develop a better understanding of where patients seek care.

Methods: National and regional patient pathway analyses (PPAs) were undertaken using existing national survey and NTP data. The PPA assessed the alignment between patient care seeking and the availability of TB diagnostic and treatment services.

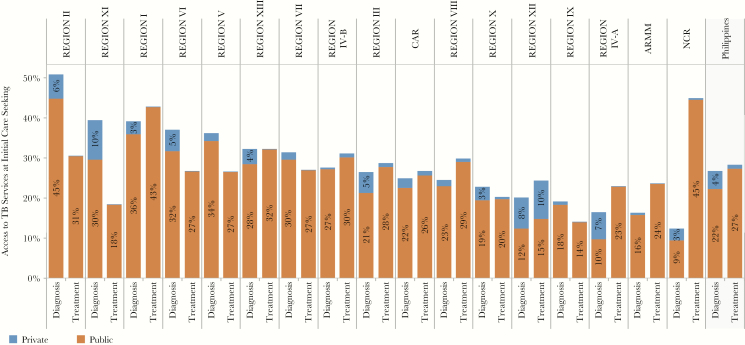
Results: Systemic referral networks from the community-level Barangay Health Stations (BHSs) to diagnostic facilities have enabled more efficient detection of drug-sensitive tuberculosis in the public sector. Approximately 36% of patients initiated care in the private sector, where there is limited coverage of appropriate diagnostic technologies. Important differences in the alignment between care seeking patterns and diagnostic and treatment availability were found between regions.

Conclusions: The PPA identified opportunities for strengthening access to care for all forms of tuberculosis and for accelerating the time to diagnosis by aligning services to where patients initiate care. Geographic variations in care seeking may guide prioritization of some regions for intensified engagement with the private sector.

Keywords: MDR-TB; care seeking; diagnosis; patient pathway analysis; tuberculosis.


Figures

Figure 1.
Figure 1.
Patient pathway visual—national level. The patient pathway describes the care seeking patterns of patients and how those patients may intersect with TB services. Column 1 starts by showing the sectors and levels of the health system (note: sectors and levels where no data was available are excluded from the pathway). The percent next to each sector title is the share of patients who initiate care seeking in this sector [6]. The next part of column 1 shows the reported number of health facilities at each sector and level. These were used as the denominator for calculations in columns 3 and 5 [18]. Outside of birthing facilities, there was no data on the number of health facilities in the private sector level 1; this level was excluded from the analysis. Finally, column 1 shows the percentage of patients who sought initial care seeking advice or treatment in a health facility [6]. Column 2 shows the percentage of health facilities that have diagnostic tests across each sector and level of the health system (i.e., coverage). Diagnostic tools are separated by tools for diagnosing drug-sensitive TB (DS-TB) and those diagnosing drug-resistant TB (DR-TB). Coverage in column 2 was calculated using the health facilities in column 1 as the denominator and a list of health facilities with TB services provided by the national TB program as the numerator [17, 18]. This list included both public and private facilities. Column 3 shows the estimated percentage of patients likely to access a facility with TB diagnosis available on their initial visit to a health care facility. This column was calculated by multiplying the share of care seeking at each sector/level of the health system by the coverage of microscopy at each respective sector/level and summing the total. Columns 3 and 5 separate public and private sectors based on each sector’s contribution to TB services access at initial care seeking. Column 4 shows the percentage of health facilities that have TB treatment available at each sector and level of the health system (i.e., coverage). Coverage of treatment services was calculated using data provided by the NTP about facilities that have TB treatment services available [17, 18]. Similar to the diagnosis coverage in column 2, treatment coverage separates those facilities that provide treatment for drug-sensitive TB (DS-TB) and those that provide treatment for drug-resistant TB (DR-TB). Column 5 shows the estimated percentage of patients likely to access a facility with TB treatment available on their initial visit to a health care facility. This column was calculated by multiplying the share of care seeking at each sector/level of the health system by the coverage of first-line treatment (DOTS) at each respective sector/level and summing the total. Column 6 shows the location of treatment among participants in the 2016 prevalence survey who had previously received TB treatment, the assumption being that this metric provides the most representative picture of where patients are treated nationwide [16]. Column 7 shows which sector provided case notification and is calculated as a share of the overall estimated incidence in 2015 [13]. Column 8 shows the treatment outcome of notified cases among the overall estimated incidence for 2015 [13]. Columns may not add to 100%, due to rounding. For more details on the data sources used in the pathway, see supplementary materials. Abbreviations: DOTS, directly observed treatment, short-course; NTP, National TB Program; TB, tuberculosis.
Figure 2.
Figure 2.
Access to TB services at initial care seeking—by region. The patient pathway analysis was completed at the national level as well as subnationally for 17 regions. The figure shows the Access to Diagnosis and Access to Treatment at Initial Care Seeking metrics across each of these regions (columns 3 and 5 of the patient pathway visual; see Figure 1). Abbreviation: TB, tuberculosis.

References

    1. United Nations General Assembly. Transforming our World: The 2030 Agenda for Sustainable Development, 2015 Available at: https://www.un.org/pga/wpcontent/uploads/sites/3/2015/08/120815_outcome-.... Accessed 1 May 2017.
    1. Philippines Statistics Authority. Census of Population, 2015 Available at https://psa.gov.ph/statistics/census/population-and-housing. Accessed 1 May 2017.
    1. United Nations Department of Economic and Social Affairs. Sustainability Development Knowledge Platform Available at: https://sustainabledevelopment.un.org/hlpf/2016/philippines. Accessed 1 May 2017.
    1. Philippines National Tuberculosis Program. Joint Tuberculosis Program Review, 2016 Available at: http://www.ntp.doh.gov.ph/downloads/publications/JPR_2016_ecopy.pdf. Accessed 1 May 2017.
    1. Philippines Department of Health. National Objectives for Health 2011–2016 Available At: http://www.doh.gov.ph/sites/default/files/publications/noh2016.pdf. Accessed 1 May 2017.

Publication types

Substances