. 2017 Nov 7;21(6):1452-1460.
doi: 10.1016/j.celrep.2017.10.034.

Circulating Glucagon 1-61 Regulates Blood Glucose by Increasing Insulin Secretion and Hepatic Glucose Production

Affiliations

Circulating Glucagon 1-61 Regulates Blood Glucose by Increasing Insulin Secretion and Hepatic Glucose Production

Nicolai J Wewer Albrechtsen et al. Cell Rep. .

Abstract

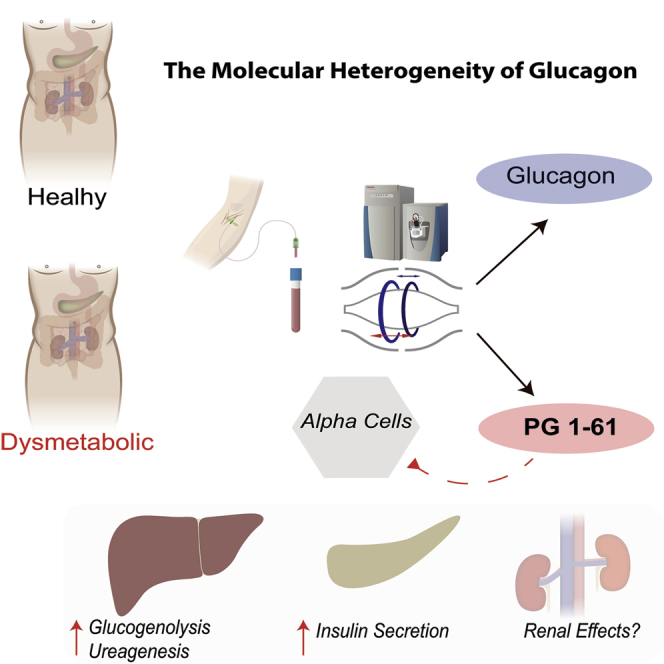
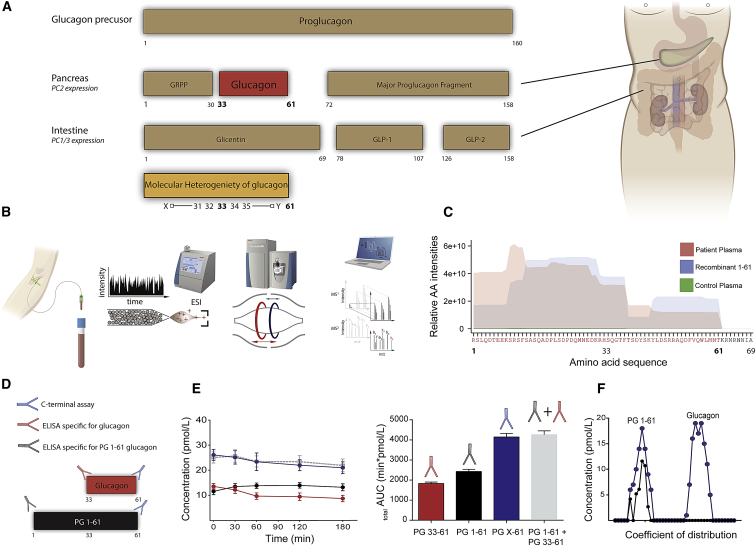
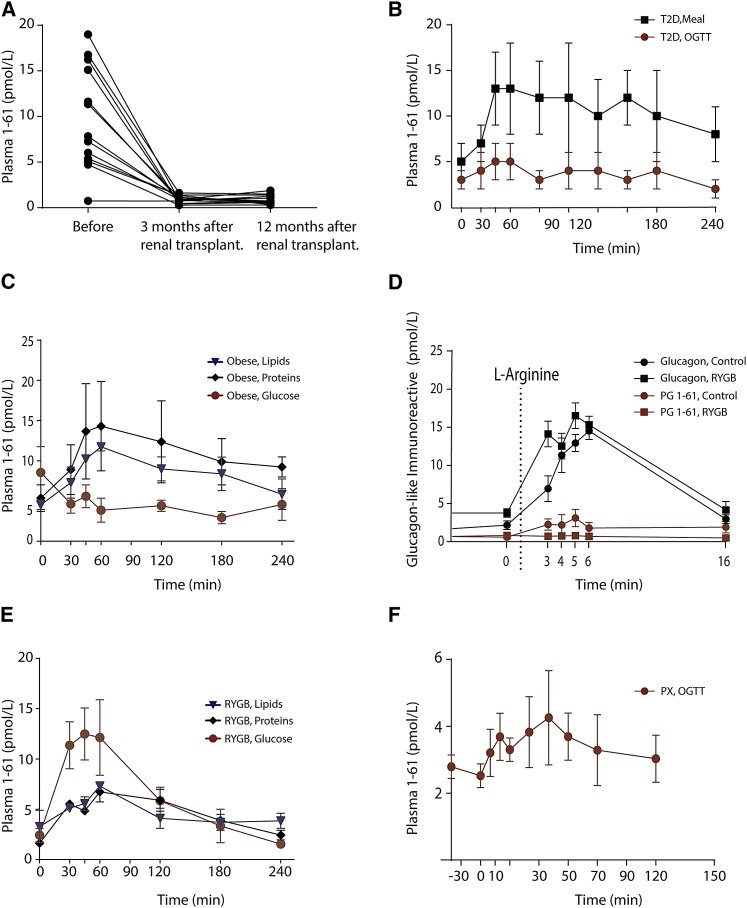
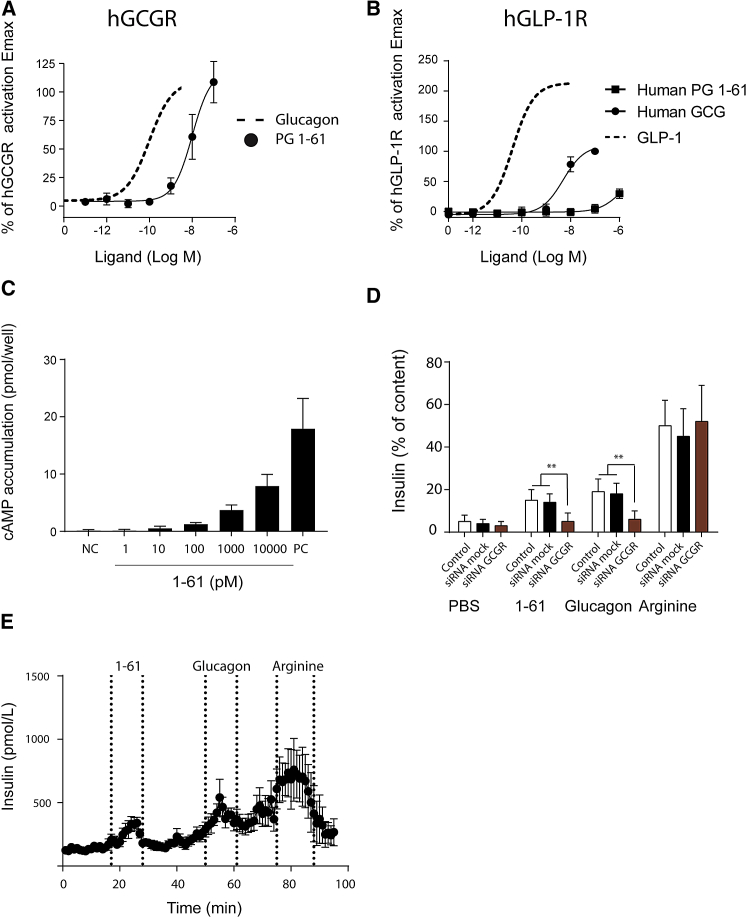
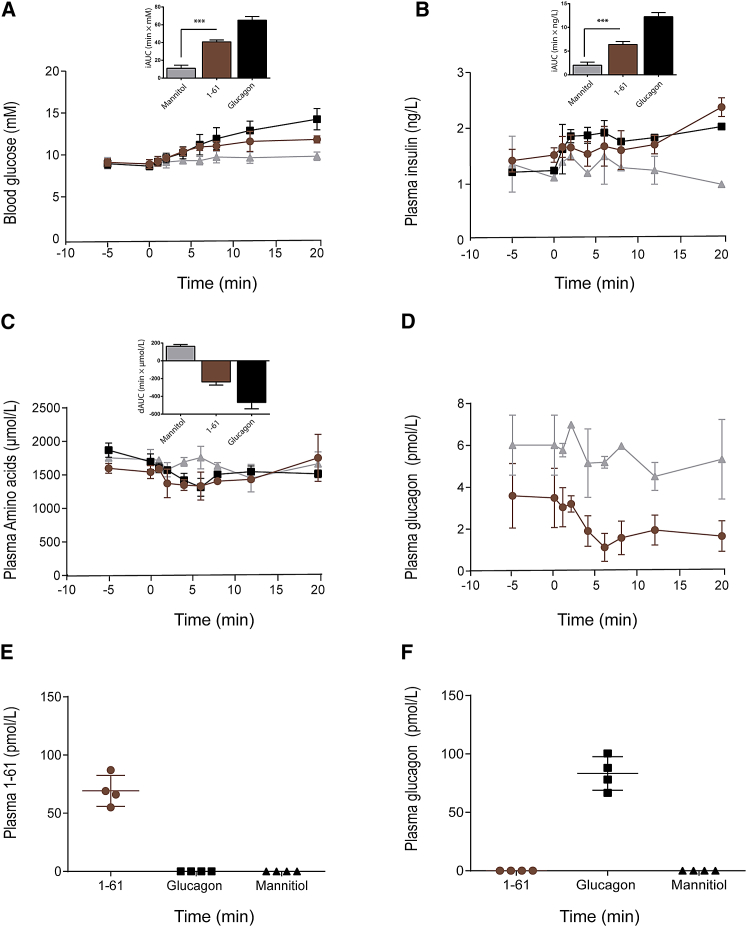
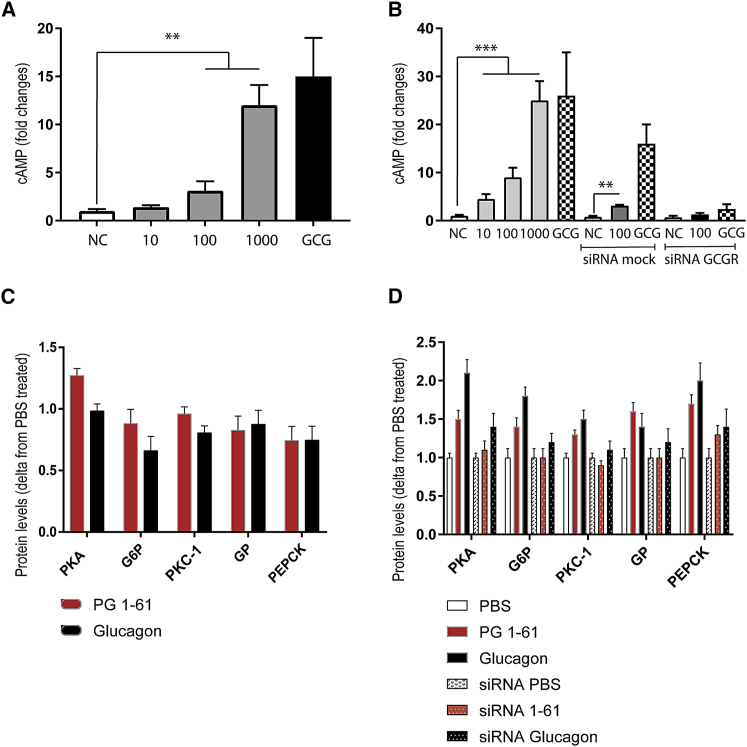
Glucagon is secreted from pancreatic α cells, and hypersecretion (hyperglucagonemia) contributes to diabetic hyperglycemia. Molecular heterogeneity in hyperglucagonemia is poorly investigated. By screening human plasma using high-resolution-proteomics, we identified several glucagon variants, among which proglucagon 1-61 (PG 1-61) appears to be the most abundant form. PG 1-61 is secreted in subjects with obesity, both before and after gastric bypass surgery, with protein and fat as the main drivers for secretion before surgery, but glucose after. Studies in hepatocytes and in β cells demonstrated that PG 1-61 dose-dependently increases levels of cAMP, through the glucagon receptor, and increases insulin secretion and protein levels of enzymes regulating glycogenolysis and gluconeogenesis. In rats, PG 1-61 increases blood glucose and plasma insulin and decreases plasma levels of amino acids in vivo. We conclude that glucagon variants, such as PG 1-61, may contribute to glucose regulation by stimulating hepatic glucose production and insulin secretion.

Keywords: GLP-1; L-cells; alpha cells; diabetes; glucagon; proglucagon; proteomics.


Figures

None
Graphical abstract
Figure 1
Figure 1
PG 1-61, a Glucagon Variant, Identified in Human Plasma by Mass Spectrometry (A) Overview of the processing of proglucagon (1-160). In the pancreas, proglucagon is processed by prohormone convertase 2 (PC2), resulting in the formation of glicentin-related pancreatic polypeptide (GRPP), glucagon, and the major proglucagon fragment. In the intestine, the actions of prohormone convertase 1/3 (PC1/3) lead to the formation of glicentin, glucagon-like peptide 1 (GLP-1), and glucagon-like peptide 2 (GLP-2). Below, potential (denoted as X and Y) N-terminally elongated and C-terminally truncated forms of glucagon are depicted. (B) A mass-spectrometry-based platform for identification of low-abundant peptides such as glucagon. In short, blood is taken from a subject, and the plasma is subjected to ultra-pressure liquid chromatography (UPLC), and the peptides are sprayed into an Orbitrap-based mass spectrometer, using an electrospray technique (ESI). The identified spectra are deconvoluted into amino acid sequences using the MaxQuant software package. (C) Separate plasma pools, obtained from subjects with kidney failure (n = 8) and from healthy subjects (n = 8), were subjected to the platform shown in (B), and the corresponding amino acid intensities are depicted as red (kidney failure) and green (healthy subjects). Synthesized PG 1-61 (positive control) is depicted in blue. (D) By comparing plasma levels of immunoreactive total glucagon (i.e., PG 1-61 + PG 33-61 [glucagon]), using a C-terminal assay (blue), to plasma levels of PG 1-61 (black) and glucagon 33-61 (red) using two sandwich ELISAs, we were able to verify immunoreactive PG 1-61 in plasma in response to an oral glucose load (E) in the same kidney failure individuals used in our mass-spectrometry-based platform (C). (F) Size-exclusion chromatography identified two major immunoreactive glucagon-like moieties using the C-terminal assay (blue): one identified having similar coefficient of distribution (Kd) as recombinant PG 1-61 (Kd = 0.22) (only immunoreactive peak identified using the PG 1-61 assay, black curve) and one similar to pancreatic glucagon (33-61) (Kd = 0.8).
Figure 2
Figure 2
PG 1-61 Responses in Subjects with a Variety of Clinical Conditions Characterized with Hyperglucagonemia (A) Plasma levels of PG 1-61 during an oral glucose tolerance test (0-min time point was analyzed and is shown) in subjects with kidney failure (end-stage renal disease) before, 3 months, and 12 months after renal transplantation. (B) PG 1-61 responses during a meal stimulation test (black) and an oral glucose tolerance test (OGTT) (red) in subjects with type 2 diabetes (T2D). (C) PG 1-61 responses during an oral glucose load (red), fat ingestion (blue), or protein ingestion (black) in obese subjects. (D) PG 1-61 (red) and glucagon (black) responses during an L-arginine test in healthy subjects (circles) or in gastric-bypass-operated subjects (squares) (Roux-en-Y gastric bypass). (E) PG 1-61 responses during an oral glucose tolerance test (red), fat ingestion (blue), or protein ingestion (black) in gastric-bypass-operated subjects (Roux-en-Y gastric bypass). (F) PG 1-61 responses during an oral glucose tolerance test in fully pancreatectomized subjects (PX). n = 8–12.
Figure 3
Figure 3
PG 1-61 Activates GCGR and Regulates Blood Glucose by Stimulating Insulin Secretion from Cultured β Cells and Isolated Pancreases (A and B) PG 1-61 activated the human glucagon receptor (hGCGR) (A) but not the human glucagon-like peptide 1 receptor (hGLP-1R) (B) with same efficacy but with lower potency compared to native glucagon in transiently transfected COS-7 cells expressing hGCGR (A) and hGLP-1R (B). (C) PG 1-61 dose-dependently stimulated levels of cAMP in INS1 cells. Positive control (PC), consisting of Bombesin, Forskolin, and IBMX, is shown. (D) PG 1-61 (1 nM) stimulated the secretion of insulin in INS1 cells; thus, this could be significantly reduced by small interfering RNA of the glucagon receptor (red), compared to small interfering RNA control (black). PBS was used as negative control, L-arginine was used as a positive control, and glucagon was used as comparator to the effects of PG 1-61. (E) Perfusions of isolated rat pancreases (n = 6) with PG 1-61 (1 nM), glucagon (1 nM), and L-arginine as positive control. PG 1-61 significantly (∗∗∗p < 0.001) increased insulin secretion. n = 6–8.
Figure 4
Figure 4
PG 1-61 Regulates Blood Glucose in Rats by Stimulating Insulin Secretion Intravenous injection with mannitol (1 g/kg, gray), PG 1-61 (1 pmol, red), or glucagon (1 pmol, black) in rats. Mannitol was used as a control for volume and osmolarity. Plasma samples were obtained subsequently during a 20-min period. (A and B) Both blood glucose (A) and plasma insulin levels (B) increased significantly after the injection of PG 1-61 and glucagon, respectively. (C) Plasma amino acids decreased significantly after the injection of PG 1-61 and glucagon. (D) Plasma glucagon levels decreased significantly after injection of PG 1-61 (red) but not mannitol (gray). (E and F) Plasma levels of PG 1-61 (E) in PG 1-61, glucagon, and mannitol-treated rats are shown, and plasma levels of glucagon (F) in PG 1-61, glucagon, and mannitol-treated rats are shown. n = 4–8.
Figure 5
Figure 5
PG 1-61 Stimulates cAMP Production in Primary and Cultured Human Hepatocytes and Increases Protein Content of Enzymes Related to Gluconeogenesis and Glycogenolysis (A) PG 1-61 stimulated cAMP production dose-dependently (10–1,000 pM) in primary human hepatocytes. As negative control (NC), we used PBS, and, as positive control (GCG), we used 100 pM glucagon. (B) PG 1-61 stimulated cAMP production dose-dependently (10–1,000 pM) in cultured human hepatocytes (HepG2). Small interfering RNA mock and small interfering RNA glucagon receptor (siRNA GCGR)-mediated knockdown are shown. As negative control (NC), we used PBS, and, as positive control (GCG), we used 100 pM glucagon. (C) PG1-61 (red, 1,000 pM) increased protein levels (30 min of incubation) of glucose-6-phosphatase (G6P), phosphorylase kinase (PKC-1), glycogen phosphorylase (GP), and phosphoenolpyruvate carboxykinase (PECK). Administration of glucagon (1,000 pM) is shown in black. (D) PG1-61 (red) increased protein levels (3-hr incubation) of protein kinase A (PKA), glucose-6-phosphatase (G6P), phosphorylase kinase (PKC-1), glycogen phosphorylase (GP), and phosphoenolpyruvate carboxykinase (PECK). In small interfering RNA-treated cells, the protein levels of these enzymes were not significantly different from PBS-treated cells (white). Corresponding original western blots are shown in Figure S4, and uncropped blots are shown in Figures S5 and S6. ∗∗p < 0.01, ∗∗∗p < 0.001 tested using one-way ANOVA corrected for multiple testing (Sidak-Holm). n = 3–6.

References

    1. Aebersold R., Mann M. Mass-spectrometric exploration of proteome structure and function. Nature. 2016;537:347–355. - PubMed
    1. Baldissera F.G., Holst J.J. Glicentin 1-61 probably represents a major fraction of glucagon-related peptides in plasma of anaesthetized uraemic pigs. Diabetologia. 1986;29:462–467. - PubMed
    1. Baranov O., Kahle M., Deacon C.F., Holst J.J., Nauck M.A. Feedback suppression of meal-induced glucagon-like peptide-1 (GLP-1) secretion mediated through elevations in intact GLP-1 caused by dipeptidyl peptidase-4 inhibition: A randomized, prospective comparison of sitagliptin and vildagliptin treatment. Diabetes Obes. Metab. 2016;18:1100–1109. - PubMed
    1. Challis B.G., Albrechtsen N.J.W., Bansiya V., Burling K., Barker P., Hartmann B., Gribble F., O’Rahilly S., Holst J.J., Simpson H.L. Heterogeneity of glucagonomas due to differential processing of proglucagon-derived peptides. Endocrinol. Diabetes Metab. Case Rep. 2015;2015:150105. - PMC - PubMed
    1. Dirksen C., Eiken A., Bojsen-Møller K.N., Svane M.S., Martinussen C., Jørgensen N.B., Holst J.J., Madsbad S. No islet cell hyperfunction, but altered gut-islet regulation and postprandial hypoglycemia in glucose-tolerant patients 3 years after gastric bypass surgery. Obes. Surg. 2016;26:2263–2267. - PubMed

MeSH terms