. 2017 Nov 7;21(6):1495-1506.
doi: 10.1016/j.celrep.2017.10.058.

CDK8 Kinase Activity Promotes Glycolysis

Affiliations

CDK8 Kinase Activity Promotes Glycolysis

Matthew D Galbraith et al. Cell Rep. .

Abstract

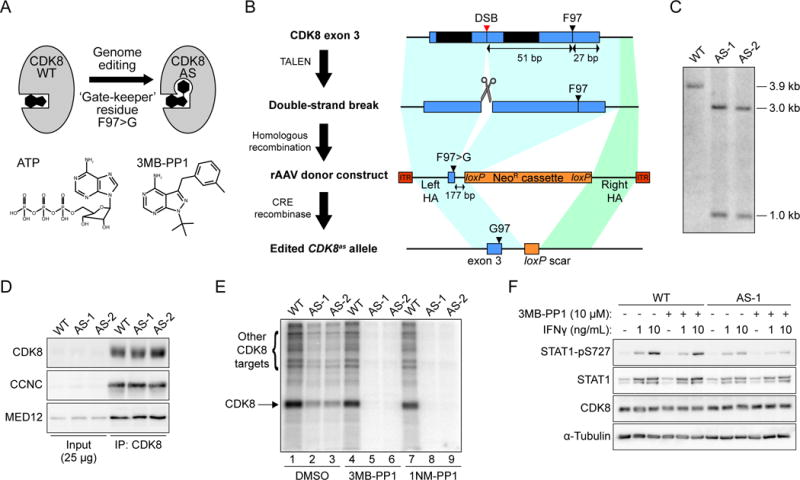
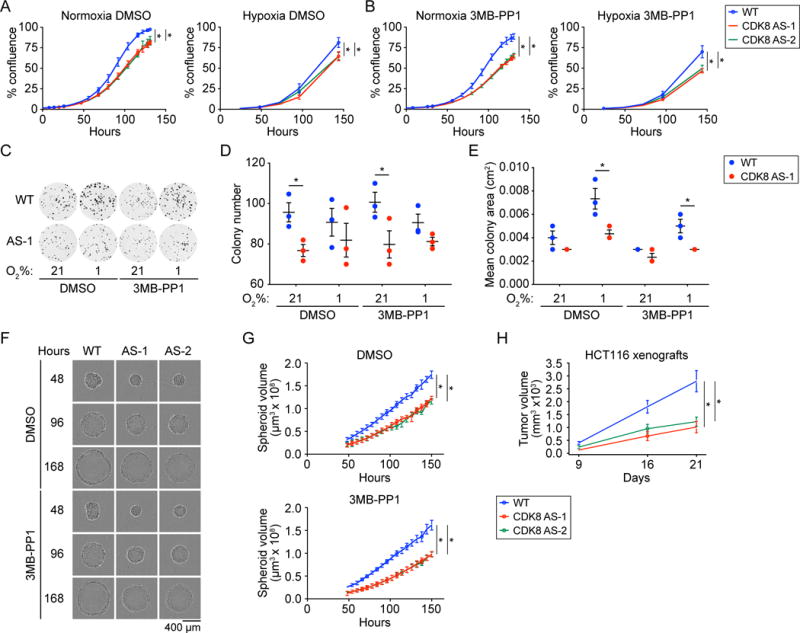
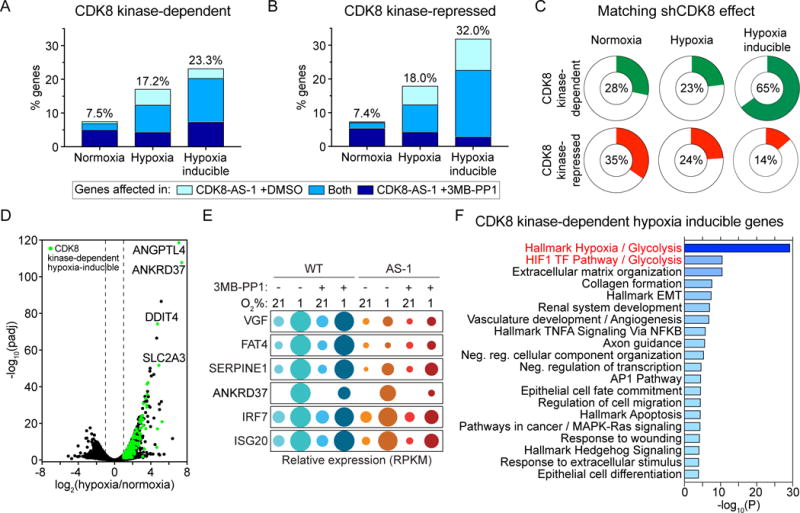
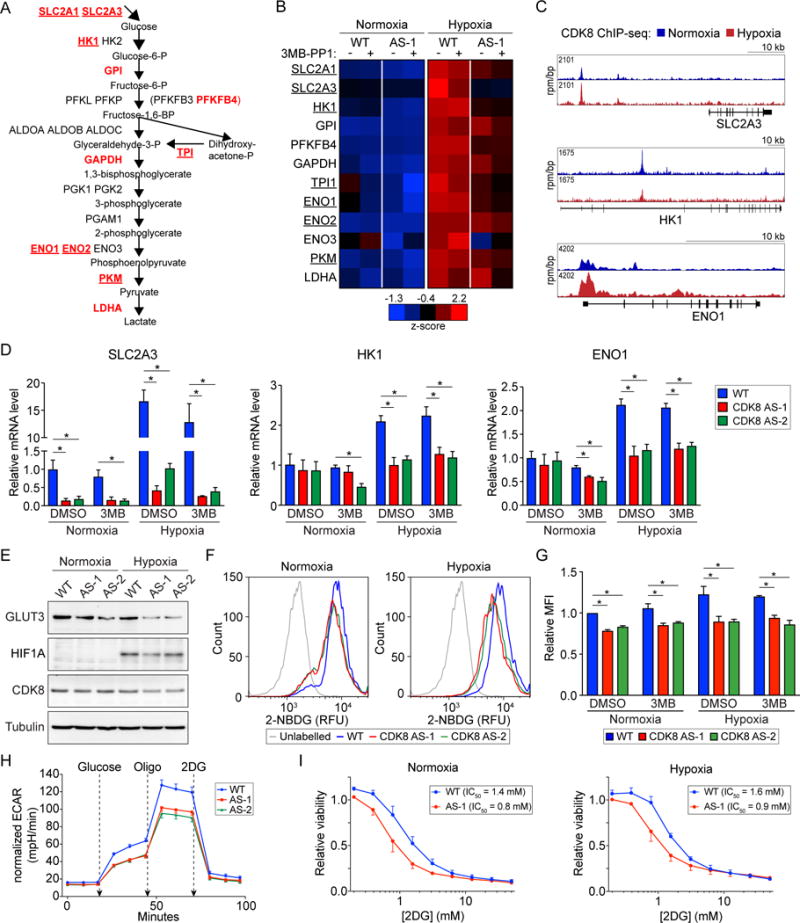
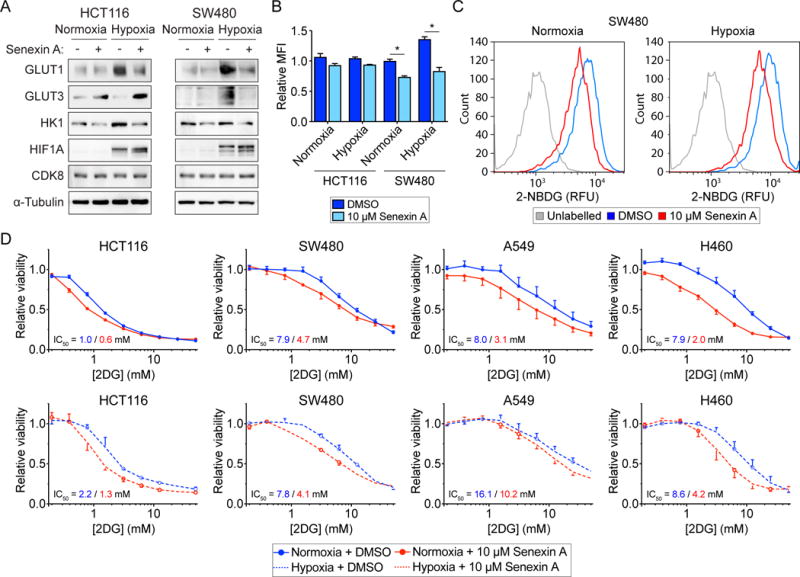
Aerobic glycolysis, also known as the Warburg effect, is a hallmark of cancerous tissues. Despite its importance in cancer development, our understanding of mechanisms driving this form of metabolic reprogramming is incomplete. We report here an analysis of colorectal cancer cells engineered to carry a single point mutation in the active site of the Mediator-associated kinase CDK8, creating hypomorphic alleles sensitive to bulky ATP analogs. Transcriptome analysis revealed that CDK8 kinase activity is required for the expression of many components of the glycolytic cascade. CDK8 inhibition impairs glucose transporter expression, glucose uptake, glycolytic capacity and reserve, as well as cell proliferation and anchorage-independent growth, both in normoxia and hypoxia. Importantly, CDK8 impairment sensitizes cells to pharmacological glycolysis inhibition, a result reproduced with Senexin A, a dual inhibitor of CDK8/CDK19. Altogether, these results contribute to our understanding of CDK8 as an oncogene, and they justify investigations to target CDK8 in highly glycolytic tumors.

Keywords: A549; CDK19; CDK8; H460; HCT116; Mediator; SW480; Warburg effect; chemical genetics; glycolysis.


Figures

Figure 1
Figure 1. Engineering and validation of CDK8as/as HCT116 cells
(A) Cartoon depicting the creation of ‘analog sensitive’ CDK8-AS by altering the ‘gate-keeper’ residue in the kinase active site. Structures of ATP and the analog 3MB-PP1 are shown for reference. (B) Outline of genome editing strategy to generate CDK8as/as HCT116 cells. Each round entailed generation of a DNA double-strand break (DSB) in exon 3 of CDK8, using a transcription activator-like effector nuclease (TALEN) pair, followed by homologous recombination with a recombinant adeno-associated virus (rAAV)-based repair donor construct containing the F97G mutation and a loxP-flanked neomycin resistance (NeoR) cassette, selection for resistance, and finally removal of the NeoR cassette using transient expression of CRE recombinase. TAL-1 and TAL-2, TALEN binding sites; HA, homology arm; ITR, inverted terminal repeat. (C) Southern blot hybridization analysis of AvrII-digested genomic DNA from WT and two independent homozygous CDK8as/as clones (AS-1 and AS-2), using a probe spanning the novel AvrII restriction site introduced along with the F97G mutation in CDK8 exon 3. Fragment sizes in kilo-base pairs are indicated at right. (D) Western blot analysis of CDK8, Cyclin C (CCNC) and MED12 levels for inputs (2.5%) and CDK8 immunoprecipitations from WT and AS lysates. (E) In vitro kinase assay with CDK8 immunoprecipitated material, as in D, showing labelling of proteins with 32P-ATP in the presence of vehicle (DMSO) or the ATP analogs 3MB-PP1 (10 μM) or 1NM-PP1 (10 μM). Arrows indicate bands representing phosphorylation of CDK8 itself, or additional proteins present in the immunoprecipitation. (F) Western blot showing levels of S727-phosphorylated STAT1 (STAT1-pS727), total STAT1, and CDK8 in HCT116 WT or CDK8 AS-1 cell lysates following treatment with interferon gamma (IFNγ) and/or 10 μM 3MB-PP1.
Figure 2
Figure 2. CDK8 activity is required for proliferation and tumorigenic properties of HCT116 cells
(A and B) Growth curves for WT and two independent homozygous CDK8as/as clones (AS-1 and AS-2) under normoxic and hypoxic (1% O2) conditions, and treated with (A) DMSO vehicle, or (B) 10 μM 3MB-PP1. Percentage confluence was monitored using an Incucyte imaging system. Data are represented as mean ± SEM from three independent replicates. Asterisks indicate significant differences (unpaired t test, p < 0.05). (C) Clonogenic cell survival assay for WT and CDK8 AS-1 in normoxia and hypoxia (1% O2), and treated with vehicle (DMSO) or 10 μM 3MB-PP1. Representative images shown. (D) Clonogenic colony number for cells treated as in C. Individual replicates are shown as circles. Lines and whiskers represent mean ± SEM from three independent replicates. Asterisks indicate significant differences (unpaired t test, p < 0.05). (E) Clonogenic colony area for cells treated as in C. Individual replicates are shown as circles. Lines and whiskers represent mean ± SEM from three independent replicates. Asterisks indicate significant differences (unpaired t test, p < 0.05). (F) Spheroid growth assay for WT and two independent homozygous CDK8as/as clones (AS-1 and AS-2) in normoxia, treated with vehicle (DMSO) or 10 μM 3MB-PP1. Representative images acquired using an Incucyte imaging system are shown. (G) Growth curves for WT, AS-1, and AS-2 spheroids, treated as in G. Spheroid volume was calculated from area as monitored using an Incucyte imaging system. Data are represented as mean ± SEM from three independent replicates. Asterisks indicate significant differences (unpaired t test, p < 0.05). (H) Xenograft tumor growth assay with wild-type and CDK8as/as HCT116 cells injected into the flanks of nude mice. Data are represented as mean ± SEM from 20 tumors per group. Asterisks indicate significant differences (unpaired t test, p < 0.05).
Figure 3
Figure 3. Inhibition of CDK8 has widespread effects on the transcriptome
(A and B) Proportions of genes expressed during normoxia and hypoxia, or induced by hypoxia, that (A) depend on CDK8 kinase activity or (B) are repressed by CDK8 kinase activity. Colors indicate the relative numbers of genes affected in CDK8-AS-1 treated with vehicle (DMSO) (light blue) or 10 μM 3MB-PP1 (dark blue), or in both conditions (medium blue). All subsequent analyses combine genes affected in CDK8-AS-1 ±3MB-PP1 (see Table S1). (C) Proportions of CDK8 kinase-dependent or –repressed genes for which CDK8 knockdown (shCDK8) produces an effect in the same direction. (D) Volcano plot of log2 fold change (hypoxia/normoxia) against -log10(FDR adjusted p value) for WT HCT116 cells, with hypoxia inducible CDK8-dependent genes highlighted in green. Selected genes of interest are labelled. (E) Bubble plots showing relative mRNA levels for example CDK8-dependent hypoxia inducible genes. Circle area corresponds to mean RPKM values relative to condition with maximum expression. (F) Top 20 clusters from Metascape pathway enrichment analysis of the 292 CDK8-dependent hypoxia-inducible genes. Color and length of bars represents −log10(p value), based on the best-scoring term within each cluster. See also Figure S3, Table S1, and Table S2.
Figure 4
Figure 4. Inhibition of CDK8 impairs glucose uptake and glycolysis
(A) Outline of the glycolysis pathway with metabolites in boxes. Glycolytic genes induced by hypoxia in HCT116 cells are listed at their corresponding step. Genes dependent on CDK8 kinase activity in hypoxia are listed in red, while those also dependent on CDK8 kinase activity in normoxia are underlined. (B) Heat map showing relative expression of CDK8 kinase-dependent glycolytic genes in WT and CDK8-AS-1 cells across normoxic and hypoxic conditions ± treatment with 10 μM 3MB-PP1. Data are represented as z-scores of mean RNA-seq RPKM values. (C) Genome browser views of CDK8 binding at selected CDK8 kinase-dependent glycolytic genes under normoxic (blue) and hypoxic (red) conditions. (D) Relative mRNA levels for selected CDK8 kinase-dependent glycolytic genes, as assessed by qRT-PCR, under normoxic and hypoxic conditions ± treatment with 10 μM 3MB-PP1. Expression values were normalized to 18S ribosomal RNA and are expressed relative to the mean of DMSO treated wild-type samples. Data are represented as mean ± SEM from three independent replicates. Asterisks indicate significant differences (unpaired t test, p < 0.05). (E) Western blot showing levels of GLUT3, HIF1A, and CDK8 in WT vs. CDK8-AS-1 and -AS-2 cells under normoxic and hypoxic conditions. (F) Representative histograms of relative fluorescence for unlabeled vs. 2-NBDG-labelled WT and CDK8-AS-1 and -AS-2 cells in normoxic and hypoxic conditions, treated with vehicle (DMSO). (G) Relative uptake of 2-NBDG by WT and CDK8-AS-1 and -AS-2 cells in normoxic and hypoxic conditions, and treated with vehicle (DMSO) or 10 μM 3MB-PP1. Data are represented as mean ± SEM from three independent replicates. Asterisks indicate significant differences (unpaired t test, p < 0.05). (H) Glycolytic function of WT vs. CDK8-AS-1 and -AS-2 cells, as measured by extracellular acidification rate (ECAR), when starved of glucose for 1 hr, and after addition of glucose followed by oligomycin (oligo) and 2DG. Data are represented as mean ± SEM from five independent replicates. Asterisks indicate significant differences (unpaired t test, p < 0.05). (I) 2DG dose-response curves for WT and CDK8-AS-1 cells under normoxic and hypoxic conditions. Data are represented as mean ± SEM from three independent replicates. See also Figure S4 and Table S1.
Figure 5
Figure 5. Senexin A reduces glucose uptake and sensitizes CRC cells to 2DG
(A) Western blots showing levels of GLUT1, GLUT3, HK1, HIF1A, and CDK8 in HCT116 and SW480 cells under normoxic conditions, and treated with vehicle (DMSO) or 10 μM Senexin A. (B) Relative uptake of 2-NBDG by HCT116 and SW480 cells in normoxic and hypoxic conditions, and treated with vehicle (DMSO) or 10 μM Senexin A. Data are represented as mean ± SEM from three independent replicates. Asterisks indicate significant differences (unpaired t test, p < 0.05). (C) Representative histograms of relative fluorescence for unlabeled vs. 2-NBDG-labelled SW480 cells in normoxic and hypoxic conditions, treated with vehicle (DMSO) or 10 μM Senexin A. (D) 2DG dose-response curves for the indicated cells under normoxic and hypoxic conditions, and treated with vehicle (DMSO) or 10 μM Senexin A. Data are represented as mean ± SEM from three independent replicates. See also Figure S5.

Comment in

References

    1. Bancerek J, Poss ZC, Steinparzer I, Sedlyarov V, Pfaffenwimmer T, Mikulic I, Dolken L, Strobl B, Muller M, Taatjes DJ, et al. CDK8 kinase phosphorylates transcription factor STAT1 to selectively regulate the interferon response. Immunity. 2013;38:250–262. - PMC - PubMed
    1. Barthel A, Okino ST, Liao J, Nakatani K, Li J, Whitlock JP, Jr, Roth RA. Regulation of GLUT1 gene transcription by the serine/threonine kinase Akt1. J Biol Chem. 1999;274:20281–20286. - PubMed
    1. Blethrow J, Zhang C, Shokat KM, Weiss EL. Design and use of analog-sensitive protein kinases. Curr Protoc Mol Biol Chapter. 2004;18 Unit 18 11. - PubMed
    1. Bost F, Decoux-Poullot AG, Tanti JF, Clavel S. Energy disruptors: rising stars in anticancer therapy? Oncogenesis. 2016;5:e188. - PMC - PubMed
    1. Briggs AW, Rios X, Chari R, Yang L, Zhang F, Mali P, Church GM. Iterative capped assembly: rapid and scalable synthesis of repeat-module DNA such as TAL effectors from individual monomers. Nucleic Acids Res. 2012;40:e117. - PMC - PubMed

MeSH terms