. 2017 Nov 7;21(6):1521-1533.
doi: 10.1016/j.celrep.2017.10.056.

Dietary Uncoupling of Gut Microbiota and Energy Harvesting from Obesity and Glucose Tolerance in Mice

Affiliations

Dietary Uncoupling of Gut Microbiota and Energy Harvesting from Obesity and Glucose Tolerance in Mice

Matthew J Dalby et al. Cell Rep. .

Abstract

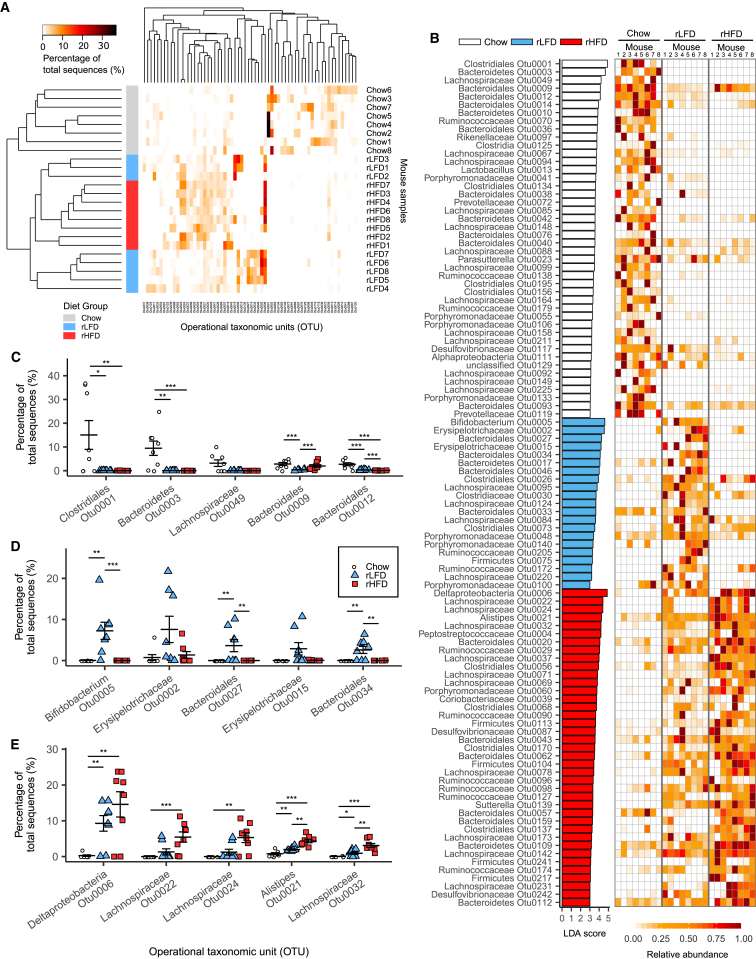
Evidence suggests that altered gut microbiota composition may be involved in the development of obesity. Studies using mice made obese with refined high-fat diets have supported this; however, these have commonly used chow as a control diet, introducing confounding factors from differences in dietary composition that have a key role in shaping microbiota composition. We compared the effects of feeding a refined high-fat diet with those of feeding either a refined low-fat diet or a chow diet on gut microbiota composition and host physiology. Feeding both refined low- or high-fat diets resulted in large alterations in the gut microbiota composition, intestinal fermentation, and gut morphology, compared to a chow diet. However, body weight, body fat, and glucose intolerance only increased in mice fed the refined high-fat diet. The choice of control diet can dissociate broad changes in microbiota composition from obesity, raising questions about the previously proposed relationship between gut microbiota and obesity.

Keywords: SCFA; chow; energy harvest; glucose intolerance; gut; high-fat diet; microbiome; microbiota; obesity.


Figures

None
Graphical abstract
Figure 1
Figure 1
Effects of Chow Diet, rLFD, and rHFD on Mouse Physiology and Phylum Ratio (A) Composition of diet nutritional composition and ingredients. (B) Macronutrient proportions of the diets. (C) Weekly body weight. (D) Weekly body fat. (E) Weekly lean mass. (F) Blood glucose concentrations following intraperitoneal glucose tolerance tests. (G) Blood glucose area under the curve (AUC). (H) Mean weekly food intake. (I) Mean weekly energy intake. (J–M) Firmicutes-to-Bacteroidetes (F:B) ratio in (J) the ileum, (K) the cecum, (L) the colon, and (M) fecal pellets. Data indicate mean ± SEM. p < 0.05, ∗∗p < 0.01, ∗∗∗p < 0.001. n = 16 mice/group for (C), (D), (E), (H), and (I). n = 8 mice per group for (F), (G), (J), (K), (L), and (M). See also Figures S1 and S2 and Table S2.
Figure 2
Figure 2
Effect of Chow Diet, rLFD, and rHFD on Ileum Microbiota Composition (A) Heatmap of OTUs (≥3% abundance) in the ileum, with rows clustered by microbiota similarity using the Bray-Curtis calculator, and columns clustered by OTUs that occur more often together. (B) OTU LDA values for chow diet-, rLFD-, and rHFD-fed mice (LDA score > 3) and heatmap showing relative abundance of each OTU between mouse samples across rows; columns represent OTUs within each sample. (C–E) Dot plots represent proportional abundance of the 5 OTUs with the highest LDA score within (C) the chow diet group, (D) the rLFD group, and (E) the rHFD group; symbols each represent individual mice with mean ± SEM. Significance determined using Metastats in mothur. p < 0.05; ∗∗p < 0.01; ∗∗∗p < 0.001. n = 8 mice per group. See also Table S2.
Figure 3
Figure 3
Effect of Chow Diet, rLFD, and rHFD on Cecum Microbiota Composition (A) Heatmap of proportion of OTUs (≥3% abundance) in the cecum, with rows clustered by microbiota similarity using the Bray-Curtis calculator, and columns clustered by OTUs that occur more often together. (B) OTU LDA values for chow diet-, rLFD-, and rHFD-fed mice (LDA score > 3) and heatmap showing relative abundance of each OTU between each mouse sample across rows; columns represent OTUs within each sample. (C–E) Dot plots represent proportional abundance of the 5 OTUs with the highest LDA score in (C) the chow diet group, (D) the rLFD group, and (E) the rHFD group, with symbols each representing individual mice with mean ± SEM. Significance was determined using Metastats in mothur. p < 0.05; ∗∗p < 0.01; ∗∗∗p < 0.001. n = 8 mice per group. See also Figure S3 and Table S2.
Figure 4
Figure 4
Effects of Individual Comparisons between Chow Diet, rLFD, and rHFD Groups (A) Comparison of ileum microbiota between chow diet and rHFD. (B) Comparison of cecal microbiota between chow diet and rHFD. (C) Comparison of ileum microbiota between chow diet and rLFD. (D) Comparison of cecal microbiota between chow diet and rLFD. (E) Comparison of ileum microbiota between rLFD and rHFD. (F) Comparison of cecal microbiota between rLFD and rHFD. Heatmaps show the proportion of OTUs (≥3% abundance), with rows clustered by microbiota similarity using the Bray-Curtis calculator, and columns clustered by OTUs that occur more often together. n = 8 mice per group. See also Figure S3 and Table S2.
Figure 5
Figure 5
Effects of Diet on Cecal Short-Chain Fatty Acids and Intestinal Morphology (A) Cecal concentrations of acetic, propionic, and butyric acid. (B) Total cecal acetic, propionic, and butyric acid. (C) Cecal concentrations of isobutyric, isovaleric, and valeric acid. (D) Total cecal isobutyric, isovaleric, and valeric acid. (E) Cecum and colon morphology. (F–H) Gut content weights in (F) the small intestine, (G) the cecum, and (H) the colon. (I–K) The length of (I) the small intestine, (J) the cecum, and (K) the colon. (L) Tissue weight of the small intestine, (M) the cecum, and (N) the colon. Data indicate mean ± SEM. n = 8 mice per group; n = 6 mice in the rLFD group in (A)–(D).

Comment in

  • Do we choose control diets wisely?
    Mandić AD, Blaut M. Mandić AD, et al. Trends Endocrinol Metab. 2018 Jul;29(7):447-448. doi: 10.1016/j.tem.2018.02.007. Epub 2018 Mar 1. Trends Endocrinol Metab. 2018. PMID: 29503099

References

    1. Arora T., Loo R.L., Anastasovska J., Gibson G.R., Tuohy K.M., Sharma R.K., Swann J.R., Deaville E.R., Sleeth M.L., Thomas E.L. Differential effects of two fermentable carbohydrates on central appetite regulation and body composition. PLoS ONE. 2012;7:e43263. - PMC - PubMed
    1. Bäckhed F., Ding H., Wang T., Hooper L.V., Koh G.Y., Nagy A., Semenkovich C.F., Gordon J.I. The gut microbiota as an environmental factor that regulates fat storage. Proc. Natl. Acad. Sci. USA. 2004;101:15718–15723. - PMC - PubMed
    1. Benjamini Y., Hochberg Y. Controlling the false discovery rate: a practical and powerful approach to multiple testing. J.R. Stat. Soc. Series B. 1995;57:289–300.
    1. Benoit B., Plaisancié P., Awada M., Géloën A., Estienne M., Capel F., Malpuech-Brugère C., Debard C., Pesenti S., Morio B. High-fat diet action on adiposity, inflammation, and insulin sensitivity depends on the control low-fat diet. Nutr. Res. 2013;33:952–960. - PubMed
    1. Black B.L., Croom J., Eisen E.J., Petro A.E., Edwards C.L., Surwit R.S. Differential effects of fat and sucrose on body composition in A/J and C57BL/6 mice. Metabolism. 1998;47:1354–1359. - PubMed

MeSH terms