. 2017 Nov 7;21(6):1692-1704.
doi: 10.1016/j.celrep.2017.10.051.

Single-Cell Virology: On-Chip Investigation of Viral Infection Dynamics

Affiliations

Single-Cell Virology: On-Chip Investigation of Viral Infection Dynamics

Feng Guo et al. Cell Rep. .

Abstract

We have developed a high-throughput, microfluidics-based platform to perform kinetic analysis of viral infections in individual cells. We have analyzed thousands of individual poliovirus infections while varying experimental parameters, including multiplicity of infection, cell cycle, viral genotype, and presence of a drug. We make several unexpected observations masked by population-based experiments: (1) viral and cellular factors contribute uniquely and independently to viral infection kinetics; (2) cellular factors cause wide variation in replication start times; and (3) infections frequently begin later and replication occurs faster than predicted by population measurements. We show that mutational load impairs interaction of the viral population with the host, delaying replication start times and explaining the attenuated phenotype of a mutator virus. We show that an antiviral drug can selectively extinguish the most-fit members of the viral population. Single-cell virology facilitates discovery and characterization of virulence determinants and elucidation of mechanisms of drug action eluded by population methods.

Keywords: live-cell imaging; microfluidics; single-cell analysis; stochastic gene expression; temporal dynamics; viral infection; virus-host interaction.


Figures

Figure 1
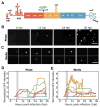
Figure 1. Isolation of single cells is essential for interpretation of replication kinetics when monitored using fluorescence
(A) GFP-PV was created by inserting GFP-coding sequence between the capsid-coding P1 region of the genome and non-structural protein-coding P2 region. Translation of the RNA produces a polyprotein; release of GFP is mediated by viral 2A protease at cleavage sites flanking the protein. Cells were infected with GFP-PV at a multiplicity of infection (MOI) of 50 genomes per cell and then either plated (B) or sorted into wells (C). (D,E) Time-lapse images of the evolution of green fluorescence is shown. On the plate, it is not possible to know if the delayed kinetics of replication is a result of the low MOI or the requirement for multiple rounds of infection. Such ambiguity does not exist for the kinetics of replication in single, isolated cells. Scale bars: 100 μm.
Figure 2
Figure 2. A microfluidic device and experimental paradigm for single-cell analysis of viral infections
(A) We created a device that contains 6,400 wells. The use of four separate sample inlets (green) and pneumatic control lines (red) permits each well and its contents to be sealed and therefore isolated from all other wells. Scale bar: 100 μm (B) The device permits real-time imaging of fluorescence in living cells. Infection of a cell by a virus expressing a fluorescent reporter should lead to a lag post-infection (ti) that transitions into a replication phase that plateaus (tj) with an ultimate decline in fluorescence caused by lysis of the infected cell (tk). (C) Plots of the fluorescence intensity observed in each well normalized to the background fluorescence of the well as a function of time revealed unprecedented, between-cell variability in the outcome of infection. (D) A plot of the average of the normalized fluorescence intensity (NFI) from the curves shown in panel C as a function of time reveals a curve similar in appearance to a growth curve measured using population methods. Error bars indicated at each time point are from 202 individual infected cells. Standard error of the mean (SEM) ranged from 0.0008 to 0.0754 NFI. One of two models could be used to describe infection outcomes: (E) infection model; (F) infection and lysis model. Both models identify phenomenological parameters that can be used to describe each curve. These are: maximum, slope, midpoint, start point and infection time. The impact of MOI on (G) maximum, (H) slope, (I) midpoint, (J) start point and (K) infection time was determined. Statistical analysis of the distributions shown in panels G–K can be found in Table S2. (L) This experiment permits measurement of the percentage of infected cells, a parameter that can only be inferred from population methods. The impact of MOI on the percentage of infected cells is shown. Data are represented as means ± standard deviation (SD) for three biological replicates.
Figure 3
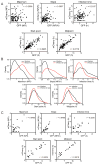
Figure 3. Independence of parameters describing single-cell infections
Each parameter obtained by fitting time courses of GFP fluorescence were compared individually to all others. With the exception of start point and midpoint, parameters were not strongly correlated. Therefore, each parameter likely reports on different aspects of viral replication and/or the interaction of the virus with the cell. The Pearson correlation coefficient (r) is indicated in each panel.
Figure 4
Figure 4. Cell cycle does not influence outcome of infection in single cells
(A) HeLa S3 cells were sorted into G0/G1 and G2/M groups by FACS as described under Materials and Methods. Cells run through the FACS and collected without sorting were used as unsorted control. (B) Averaged curves of viral infection dynamics on single cells using unsorted cells, G0/G1 cells, and G2/M cells. Data are represented as means ± SEM. (C–G) Distributions of maximum, slope, midpoint, start point and infection time revealed statistically insignificant contribution of cell cycle to the heterogeneity of viral infection dynamics at the single-cell level (Table S4).
Figure 5
Figure 5. Contribution of virus or host to the parameters describing viral infection of single cells and determinants of a non-lytic outcome of infection
(A) HeLa S3 cells were infected with GFP-PV and mCherry-PV at an MOI of 2,000 genomes (2 pfu) per cell. Indicated parameters from co-infected cells were plotted. Virus-dependent parameters will not exhibit a correlation between GFP and mCherry fluorescence; cell-dependent parameters will. The Pearson correlation coefficient (r) is indicated in each panel. The virus determines the maximum, slope and infection time, but the cell determines the start point and midpoint. (B) Cells were infected with GFP-PV at an MOI of 500 genomes (0.5 pfu) per cell and monitored for 24 h. We divided events into two categories: those that failed to lyse during the 24-h time period (Infection), and those that lysed (Infection & lysis). Comparison of the distributions of all parameters is shown. Infections with a non-lytic outcome showed a statistically significant reduction in the parameters for maximum, slope and infection time, parameters thought to be governed by the virus (Table S5). (C) Cells were infected with both GFP-PV and mCherry-PV at an MOI of 2,000 genomes (2 pfu) per cell and monitored for 24 h. We divided events as described above. Cells that were co-infected and failed to lyse over the 24-h time period were analysed for correlations as described in panel A. In addition to parameters for start-point and midpoint, infected cells that failed to lyse exhibited strong correlation now in the parameters for maximum and slope, suggesting that the cell contributes substantively to the lytic/non-lytic fate of the cell post-infection.
Figure 6
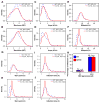
Figure 6. Insight into the mechanism of attenuation of a mutator PV
Cells were infected at the indicated MOI with either WT PV or a mutant that exhibits a mutator phenotype, referred to here as H273R. WT was compared to H273R at the two multiplicities indicated by evaluating the distributions for the values of the maximum (A,B), slope (C,D) midpoint (E,F), start point (G,H) and infection time (I,J). This analysis revealed a significant delay in the start point for H273R relative to WT (Table S6). Analysis of the percentage of infected cells (K) revealed a reduction in infections established by H273R relative to WT at low MOI. Data are represented as means ± SD for three biological replicates.
Figure 7
Figure 7. Selective extinction of the most-fit members of the viral population by an antiviral ribonucleoside
GFP-PV was used to infect cells grown in the absence or presence of 50 μM 2′-C-methyladenosine (2′-C-meA), the IC50 value for this compound. Infected cells were loaded in the device and growth continued in the absence or presence of the drug. (A) Percentage of infected cells was reduced by roughly half in the presence of 2′-C-meA. Data are represented as means ± SD for three biological replicates. (B) The distribution of values for the maximum showed that cells with high values were preferentially eliminated by drug treatment. (C) The distribution of values for the slope showed that cells with high values were preferentially eliminated by drug treatment. (D,E,F) The distributions of values for the (D) midpoint, (E) start point and (F) infection time were unaffected by drug treatment. (G) A 2D analysis of values for the maximum versus values for the slope showed elimination of the most efficient replicators in the population by the drug. Area eliminated in presence of drug is highlighted in yellow.

References

    1. Aguilera ER, Erickson AK, Jesudhasan PR, Robinson CM, Pfeiffer JK. Plaques Formed by Mutagenized Viral Populations Have Elevated Coinfection Frequencies. mBio. 2017:8. - PMC - PubMed
    1. Akpinar F, Timm A, Yin J. High-Throughput Single-Cell Kinetics of Virus Infections in the Presence of Defective Interfering Particles. Journal of virology. 2016;90:1599–1612. - PMC - PubMed
    1. Appleby TC, Perry JK, Murakami E, Barauskas O, Feng J, Cho A, Fox D, 3rd, Wetmore DR, McGrath ME, Ray AS, et al. Viral replication. Structural basis for RNA replication by the hepatitis C virus polymerase. Science. 2015;347:771–775. - PubMed
    1. Arias A, Thorne L, Ghurburrun E, Bailey D, Goodfellow I. Norovirus Polymerase Fidelity Contributes to Viral Transmission In Vivo. mSphere. 2016:1. - PMC - PubMed
    1. Arnold JJ, Vignuzzi M, Stone JK, Andino R, Cameron CE. Remote site control of an active site fidelity checkpoint in a viral RNA-dependent RNA polymerase. The Journal of biological chemistry. 2005;280:25706–25716. - PMC - PubMed

LinkOut - more resources