Comparative Study
. 2017 Dec;27(12):2001-2014.
doi: 10.1101/gr.225730.117. Epub 2017 Nov 8.

Comparative genome analysis of programmed DNA elimination in nematodes

Affiliations
Comparative Study

Comparative genome analysis of programmed DNA elimination in nematodes

Jianbin Wang et al. Genome Res. 2017 Dec.

Abstract

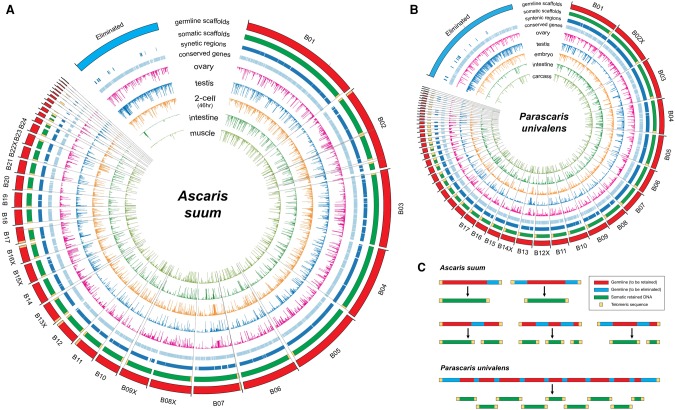
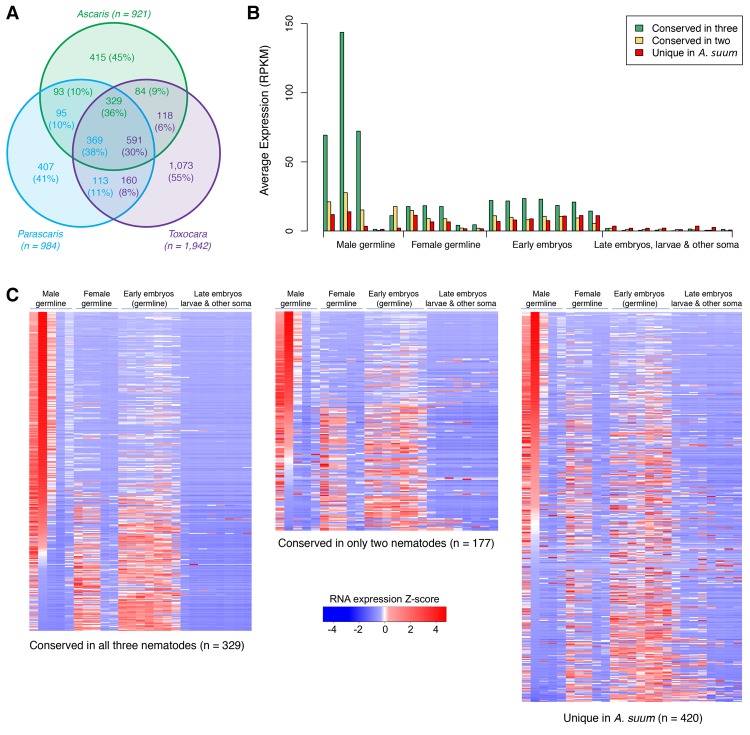
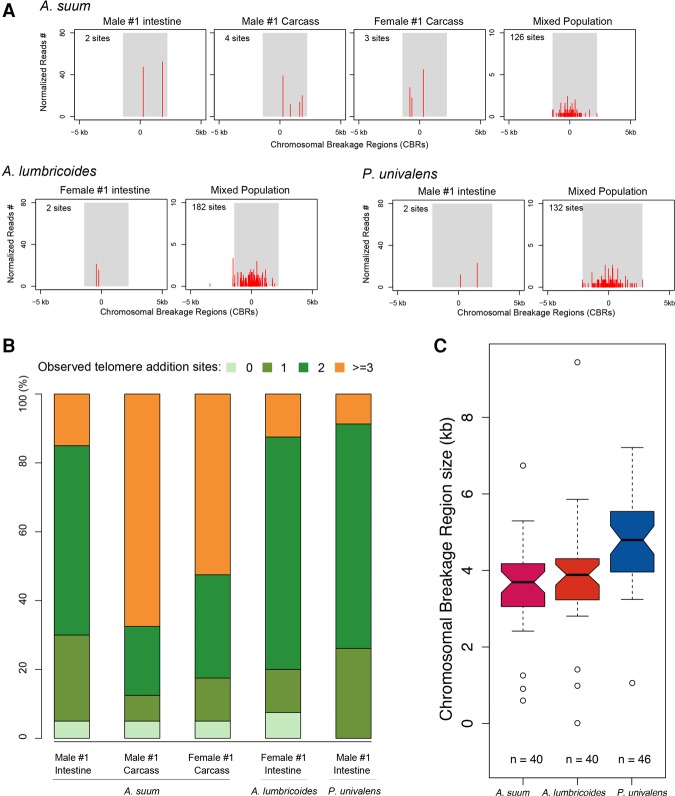
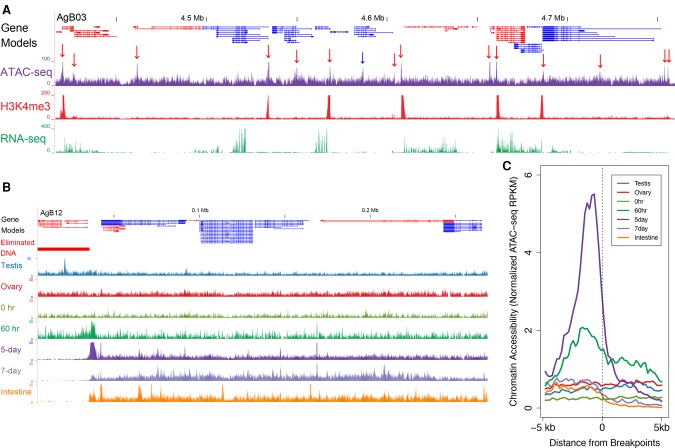
Programmed DNA elimination is a developmentally regulated process leading to the reproducible loss of specific genomic sequences. DNA elimination occurs in unicellular ciliates and a variety of metazoans, including invertebrates and vertebrates. In metazoa, DNA elimination typically occurs in somatic cells during early development, leaving the germline genome intact. Reference genomes for metazoa that undergo DNA elimination are not available. Here, we generated germline and somatic reference genome sequences of the DNA eliminating pig parasitic nematode Ascaris suum and the horse parasite Parascaris univalens. In addition, we carried out in-depth analyses of DNA elimination in the parasitic nematode of humans, Ascaris lumbricoides, and the parasitic nematode of dogs, Toxocara canis. Our analysis of nematode DNA elimination reveals that in all species, repetitive sequences (that differ among the genera) and germline-expressed genes (approximately 1000-2000 or 5%-10% of the genes) are eliminated. Thirty-five percent of these eliminated genes are conserved among these nematodes, defining a core set of eliminated genes that are preferentially expressed during spermatogenesis. Our analysis supports the view that DNA elimination in nematodes silences germline-expressed genes. Over half of the chromosome break sites are conserved between Ascaris and Parascaris, whereas only 10% are conserved in the more divergent T. canis. Analysis of the chromosomal breakage regions suggests a sequence-independent mechanism for DNA breakage followed by telomere healing, with the formation of more accessible chromatin in the break regions prior to DNA elimination. Our genome assemblies and annotations also provide comprehensive resources for analysis of DNA elimination, parasitology research, and comparative nematode genome and epigenome studies.


Figures

Figure 1.
Figure 1.
Ascaris chromosome landscapes and genome annotation. (A) Landscape of three Ascaris chromosomes. Illustrated along the length of three assembled Ascaris somatic chromosomes with centromeric regions (defined by CENP-A ChIP-seq; blue), actively transcribed regions (defined by H3K36me3 ChIP-seq; red), heterochromatic regions (defined by H3K9me3 ChIP-seq; green dots), and putative transposon elements illustrated (TEs defined by sequence homology; orange dots). (B) Ascaris genome browser view. An expanded view of the gene models, histone marks, RNA-seq, small RNA data, and 5′ ends of mRNA from the shaded area of chromosome AsR004 in Figure 1A. ChIP-seq data are from 5 d (32–64 cell) embryos. Units for all tracks are normalized to 10× genome coverage (3 Gbp). (SL) spliced leader sequence.
Figure 2.
Figure 2.
Improved Ascaris gene models, alternative splicing, and RNA expression profiles. (A) Improved Ascaris gene models. Illustrated is a genome browser locus view for selected RNA-seq tracks and a comparison of gene models defined in previous papers (Jex et al. 2011; Wang et al. 2012) and here defined with a gene prediction program (AUGUSTUS) (Stanke et al. 2006) and with new RNA-seq data (Current Gene Models) (see Supplemental Material). Comprehensive RNA-seq data from 25 different developmental stages were used to refine Ascaris gene models. (B) Refined and new gene models. Comparison of the gene models between previous studies and the current version reveals that (1) many previously defined independent genes correspond to single genes and have been merged in the current genome annotations, and (2) an additional approximately 5500 (30%) new genes were identified and annotated in our revision. (C) Alternative splicing in Ascaris and Parascaris. Alternatively spliced isoforms were identified using comprehensive RNA-seq data sets in Ascaris and Parascaris (see Supplemental Material). (D) Ascaris developmental RNA expression profiles. The heatmap illustrates the dynamic expression of 10,874 genes (with average RPKM ≥5 or max RPKM ≥20) across the 25 different developmental stages of Ascaris (see Supplemental Material), including regions of the male germline (1, mitotic region; 2, spermatogenesis; 3, post-meiotic region; 4, seminal vesicle; and 5, spermatids), regions of the female germline (1, mitotic region; 2, early pachytene; 3, late pachytene; 4, diplotene; and 5, oocyte), zygote maturation stages prior to pronuclear fusion isolated from the uterus (z1-4) (see Wang et al. 2014), early development stages (1c, 1-cell [24 h of development at 30°C]; 2c, 2-cell [46 h]; 4c, 4-cell [64 h]; 16c, 16-cell [96 h]; 5d, 5-day [32–64 cells]; and 7 d, 7-d [about 256 cells]), larvae (L1 and L2), and adult somatic tissues. (Mu) Muscle; (In) intestine; (Ca) carcass, which includes the cuticle, hypodermis, muscle, nervous system, and pharynx.
Figure 3.
Figure 3.
Ascaris and Parascaris programmed DNA elimination genome changes. (A) Breakpoints and eliminated sequences in Ascaris. Illustrated are Ascaris genomic regions (scaffolds) that are partially or completely eliminated (blue in germline scaffold ring). Scaffolds with DNA breakpoints are shown in red within the germline scaffolds ring (the largest outer circle). The positions for the 40 identified DNA break regions are shown as black lines connecting the largest and smallest circles. Genomic regions (scaffolds) eliminated were concatenated for illustration and are shown as a blue block (ring). The somatic scaffolds track indicates the retained somatic sequences. Telomeres are indicated as yellow boxes. Note that all breaks are healed by new telomere addition. The syntenic regions and conserved genes between Ascaris and Parascaris are illustrated in the light blue ring/track. Gene transcript levels (derived from RNA-seq data) for the germline, two-cell embryo, and several somatic tissues are illustrated in the inner circles. Note the high level of RNA expression in the testis corresponding to DNA eliminated regions. In addition, a few of the eliminated genes (six out of 921) appear to be expressed in the soma due to paralogous genes that are retained or to low level contamination of highly expressed germline genes (see Supplemental Text). (B) Breakpoints and eliminated sequences in Parascaris. Presentation is the same as in Figure 3A. Circle plots are not drawn to scale. (C) DNA elimination at the chromosome level in Ascaris and Parascaris (see text).
Figure 4.
Figure 4.
Conservation of eliminated nematode genes and their expression during spermatogenesis. (A) Conservation of eliminated genes among Ascaris, Parascaris, and Toxocara (see Supplemental Material). The color-coded values illustrate the direct gene comparison for each genus. Note that there is more than one value as not all gene comparisons among these nematodes correspond to a 1:1 match. (B) Expression of Ascaris genes that are eliminated in all three nematodes, eliminated in two nematodes, or the eliminated genes unique to Ascaris (for description of the stages, see Fig. 2D). (C) Heatmap showing the expression of conserved versus nonconserved eliminated Ascaris genes in different developmental stages (for description of the stages, see Fig. 2D).
Figure 5.
Figure 5.
Heterogeneity of telomere addition sites. (A) Telomere addition sites on somatic chromosomes following DNA elimination. A telomere addition site in A. suum (break_a16) and the corresponding telomere addition sites in A. lumbricoides or in P. univalens (break17) are illustrated. The shaded area corresponds to the defined CBRs (determined by the breadth of telomere addition sites at a break in a population of cells), and the red ticks are the frequency and position of the observed telomere addition sites. The center of the CBR is defined as where the highest density of observed telomere addition sites is found in the population. The regions to the left (negative) correspond to retained DNA, while regions to the right (positive) correspond to eliminated DNA. The read frequency was normalized to 50× genome coverage (with 100-bp read length). Note that in an individual there are a limited number of sites that undergo telomere healing. In contrast, in a population, the breadth of telomere addition sites observed is the sum of the independent events in each individual. (B) Compilation of the number of observed telomere addition sites for all 40 breakpoints in Ascaris and 46 breakpoints in Parascaris. (C) Chromosomal breakage region size defined for Ascaris and Parascaris. The region is defined by the extent of all telomere addition sites at a break area.
Figure 6.
Figure 6.
Increased chromatin accessibility is associated with Ascaris CBRs. (A) ATAC-seq identifies accessible chromatin at Ascaris promoters. Gene models, transcripts (red, plus strand; blue, minus strand) and H3K4me3 ChIP-seq illustrated in a genome region of 5-d embryos (32- to 64-cell stage). For ATAC-seq data, red arrows indicate peaks of more accessible chromatin near transcriptional start sites, while the blue arrow points to open chromatin within a gene. Note the ATAC-seq signal is enriched at promoters/transcription start sites. Also illustrated are RNA-seq data for 5-d embryos. (B) Ascaris CBRs exhibit increased chromatin accessibility just prior to DNA elimination. The developmental ATAC-seq profile for a DNA breakpoint region (from AgB03) is illustrated. Note that in addition to the transcription start site–associated ATAC-seq peaks, a broad area of open chromatin appears within the break region at the four-cell stage (60 h) immediately prior to DNA elimination. This region remains open through early development (5 d; gastrulation) but is closed in late embryos (7 d; morphogenesis) and somatic tissues (intestine and muscle). (C) Chromatin accessibility for 40 Ascaris breakpoint regions. Illustrated are the breakpoints with their 5-kb flanking regions. Upstream of the breakpoints (−5 kb to 0) are the retained DNA, while downstream regions (0 to 5 kb) are the eliminated regions. Note the open chromatin at the breakpoints in 60 h (immediately prior to DNA elimination) that increases and persists in 5-d embryos. In addition, note that the open regions correspond exactly to the CBRs defined by chromosomal breaks and telomere addition.

References

    1. Allen MA, Hillier LW, Waterston RH, Blumenthal T. 2011. A global analysis of C. elegans trans-splicing. Genome Res 21: 255–264. - PMC - PubMed
    1. Bachmann-Waldmann C, Jentsch S, Tobler H, Muller F. 2004. Chromatin diminution leads to rapid evolutionary changes in the organization of the germ line genomes of the parasitic nematodes A. suum and P. univalens. Mol Biochem Parasitol 134: 53–64. - PubMed
    1. Baird SE, Klobutcher LA. 1989. Characterization of chromosome fragmentation in two protozoans and identification of a candidate fragmentation sequence in Euplotes crassus. Genes Dev 3: 585–597. - PubMed
    1. Bassing CH, Swat W, Alt FW. 2002. The mechanism and regulation of chromosomal V(D)J recombination. Cell 109(Suppl: S45–S55. - PubMed
    1. Betermier M, Duharcourt S. 2014. Programmed rearrangement in ciliates: paramecium. Microbiol Spectr 2 10.1128/microbiolspec.MDNA3-0035-2014. - DOI - PubMed

Publication types

MeSH terms