. 2018 Jan 19;122(2):296-309.
doi: 10.1161/CIRCRESAHA.117.311769. Epub 2017 Nov 8.

Induced Pluripotent Stem Cell (iPSC)-Derived Extracellular Vesicles Are Safer and More Effective for Cardiac Repair Than iPSCs

Affiliations

Induced Pluripotent Stem Cell (iPSC)-Derived Extracellular Vesicles Are Safer and More Effective for Cardiac Repair Than iPSCs

Marta Adamiak et al. Circ Res. .

Abstract

Rationale: Extracellular vesicles (EVs) are tiny membrane-enclosed droplets released by cells through membrane budding or exocytosis. The myocardial reparative abilities of EVs derived from induced pluripotent stem cells (iPSCs) have not been directly compared with the source iPSCs.

Objective: To examine whether iPSC-derived EVs can influence the biological functions of cardiac cells in vitro and to compare the safety and efficacy of iPSC-derived EVs (iPSC-EVs) and iPSCs for cardiac repair in vivo.

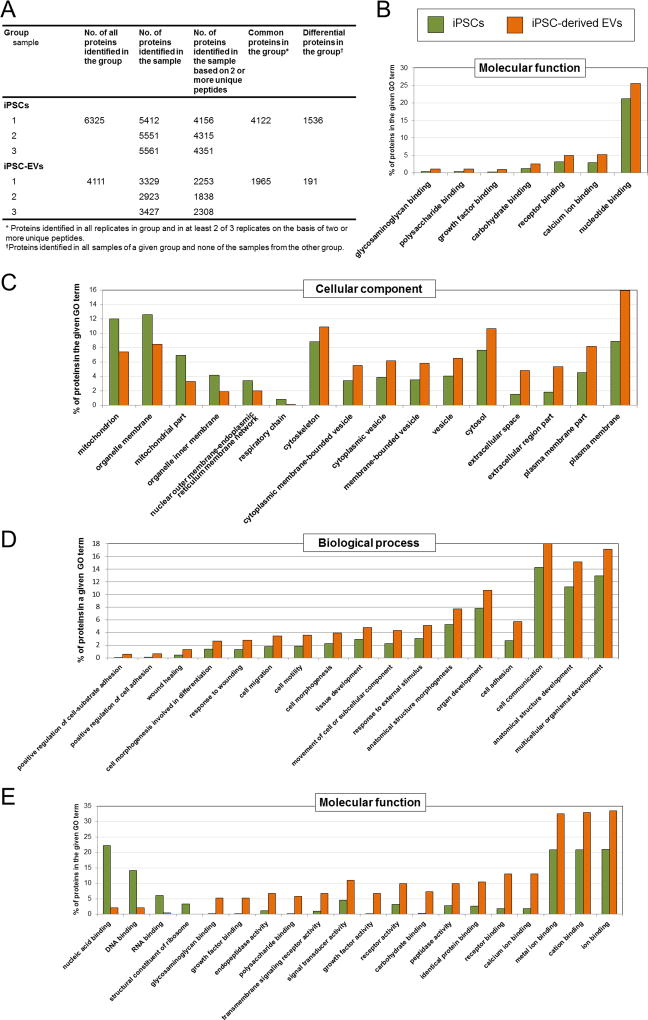
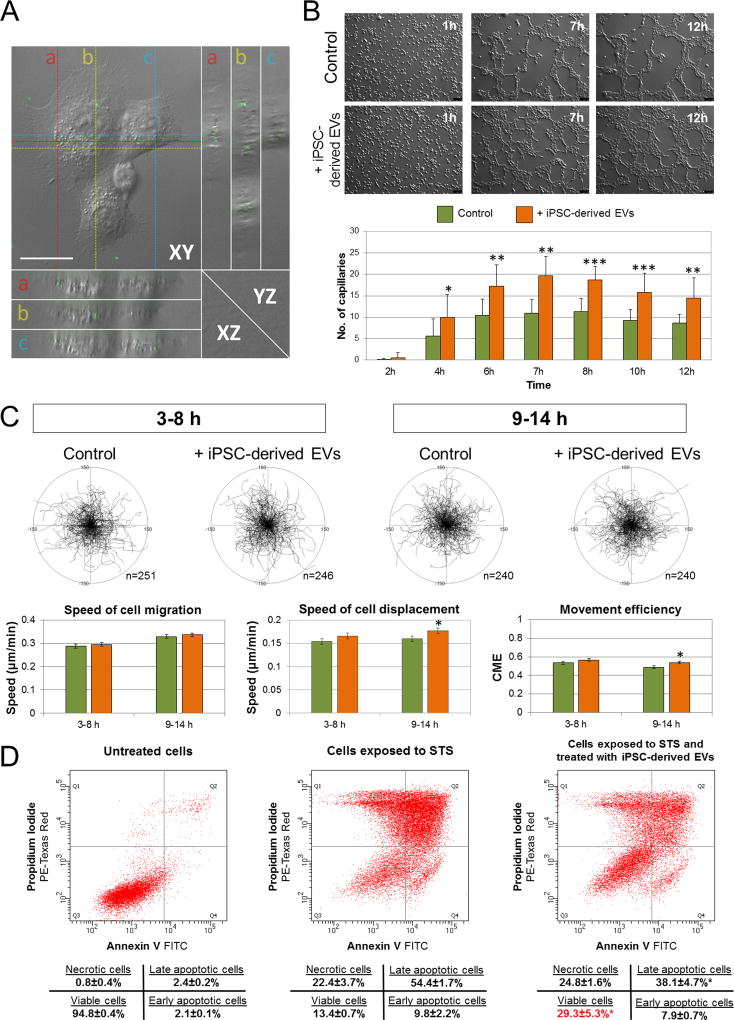
Methods and results: Murine iPSCs were generated, and EVs isolated from culture supernatants by sequential centrifugation. Atomic force microscopy, high-resolution flow cytometry, real-time quantitative RT-PCR, and mass spectrometry were used to characterize EV morphology and contents. iPSC-EVs were enriched in miRNAs and proteins with proangiogenic and cytoprotective properties. iPSC-EVs enhanced angiogenic, migratory, and antiapoptotic properties of murine cardiac endothelial cells in vitro. To compare the cardiac reparative capacities in vivo, vehicle, iPSCs, and iPSC-EVs were injected intramyocardially at 48 hours after a reperfused myocardial infarction in mice. Compared with vehicle-injected mice, both iPSC- and iPSC-EV-treated mice exhibited improved left ventricular function at 35 d after myocardial infarction, albeit iPSC-EVs rendered greater improvement. iPSC-EV injection also resulted in reduction in left ventricular mass and superior perfusion in the infarct zone. Both iPSCs and iPSC-EVs preserved viable myocardium in the infarct zone, whereas reduction in apoptosis was significant with iPSC-EVs. iPSC injection resulted in teratoma formation, whereas iPSC-EV injection was safe.

Conclusions: iPSC-derived EVs impart cytoprotective properties to cardiac cells in vitro and induce superior cardiac repair in vivo with regard to left ventricular function, vascularization, and amelioration of apoptosis and hypertrophy. Because of their acellular nature, iPSC-EVs represent a safer alternative for potential therapeutic applications in patients with ischemic myocardial damage.

Keywords: angiogenesis; apoptosis; extracellular vesicles; induced pluripotent stem cells; myocardial infarction; remodeling; stem cells.


Figures

Figure 1
Figure 1. iPSC characterization
A. Representative dot-plots showing the expression of intracellular markers of pluripotency in iPSCs. B–C. Representative images showing the morphology of iPSC colonies in serum- and feeder-free culture and fluorescence staining for fetal alkaline phosphatase (PALP) activity (B); and expression of pluripotency markers Oct3/4, Nanog, Sox2 and SSEA-1 (C). Scale bar: 200 µm. D. Representative histograms showing the antigenic phenotype of iPSCs by flow cytometry. The red-colored histograms represent samples stained for specific surface antigens, while gray-colored ones correspond to respective unstained control samples. Data represent mean ± SD from three independent experiments.
Figure 2
Figure 2. Characterization of iPSC-EVs
A. Representative iPSC-EV size distribution histogram by nanoparticle tracking analysis (NTA). The cumulative D50 parameter indicates that 50% of the population of vesicles is smaller than 143 nm in diameter. B. Left: representative atomic force microscopy (AFM) image of iPSC-derived EVs. Scale bar, 50 nm. Right: 3D topography of individual vesicles. Scan area: 250×250 nm. C. The Young’s modulus [kPa] and adhesion [pN] values by AFM, reflecting mechanical properties of iPSC-EVs. D. High resolution flow cytometry. Left: histogram showing the size distribution of mixed-size synthetic beads (PS, fluorescently labeled polystyrene calibration beads detected in FITC channel; Si, unlabeled silicone calibration beads). Right: representative dot-plots show the medium angle light scatter (MALS) related to EV size vs. fluorescence intensity indicating expression of selected EV-specific (CD81), and iPSC-specific (SSEA-1) antigens on iPSC-EVs. E. Representative Western immunoblot confirming the presence of typical exosomal marker CD9 in iPSC-EV specimens. F. Presence of mRNA transcripts for pluripotency-related markers in iPSCs and iPSC-EVs by real-time RT-PCR. Data are shown as CT Mean values. G. Venn diagram showing the number of miRNAs common and specific for iPSCs and iPSC-EVs. H. Scatter plot of miRNA expression in iPSCs (x axis) and iPSC-EVs (y axis); each dot represents one transcript. Data represent mean ± SD from three independent experiments.
Figure 3
Figure 3. Global proteomic contents of iPSCs and iPSC-EVs by mass spectrometry
A. The number of proteins identified in iPSCs and their EVs. The absolute values are shown individually for each replicate (n=3) and as average for each examined group. B–D. Gene Ontology (GO) analysis, including common proteins detected in both iPSCs and iPSC-EVs, with focus on molecular function, cellular components, and biological processes. E. GO enrichment analysis for differential expression of proteins in iPSCs and iPSC-EVs, with focus on molecular function. GO terms related to the most apparent differences between iPSCs and iPSC-EVs are shown.
Figure 4
Figure 4. Impact of iPSC-EVs on cardiac endothelial cell (CEC) function
A. Representative Z-stacked image showing uptake of fluorescently labeled iPSC-EVs by CECs. One set of orthogonal slices is shown. Middle, right, and bottom panels represent XY, YZ and XZ planes, respectively. YZ and XZ planes intersect according to the crosshairs. Scale bar: 10 µm. B–D. Impact of iPSC-EVs on CEC functions: (B) angiogenic capacity on Matrigel; scale bar: 100 µm. Each bar represents mean values ± SD from 3 independent experiments (***P<0.001, **P<0.01, *P<0.1); (C) migratory activity of untreated CECs (Control) and CECs treated with iPSC-EVs. Cell trajectories for each period are depicted as circular diagrams (axis scale in µm). Selected migration parameters are shown on the graphs (bottom). Each bar represents mean values from 3 independent experiments (*P<0.05); (D) Representative dot-plots showing the impact of treatment with iPSC-EVs on survival of CECs after exposure to cytotoxic agent staurosporine. Data represent mean ± SD from 3 independent experiments (*P<0.05).
Figure 5
Figure 5. Assessment of LV systolic function
A. Representative M-mode images from vehicle-treated, iPSC-treated, and iPSC-EV-treated mice at 35 d after coronary occlusion/reperfusion. Compared with the vehicle-treated heart, both iPSC-treated and iPSC-EV-treated hearts exhibit improved wall motion, smaller LV cavity (D,E), and thicker infarct wall (F). Transplantation of iPSC-EVs resulted in greater improvement in LV systolic function (B,C). Data are mean ± SEM. n=7–12 mice per group. *P<0.05 vs. Vehicle at 35 d; #P<0.05 vs. iPSC group at 35 d. BSL, baseline; d, days; LV, left ventricular.
Figure 6
Figure 6. Assessment of LV remodeling and hypertrophy
A. Representative Masson’s trichrome-stained myocardial sections at 35 d after MI show improved remodeling in iPSC and iPSC-EV-treated hearts. Scar tissue and viable myocardium are identified in blue and red, respectively. Scale bar = 500 µm. Echocardiographically estimated LV end-diastolic diameter (B) was smaller in both iPSC- and iPSC-EV-treated groups compared with the vehicle-treated group. LV infarct wall thickness in diastole (C) was greater and posterior wall thickness (D) was smaller in both groups. E–F. Interstitial fibrosis in the viable myocardium was quantitated in picrosirius red-stained myocardial sections (E) at 35 d after MI and quantified (F). Scale bar = 50 µm. G. Echocardiographically estimated LV mass was smaller in iPSC-EV-treated hearts compared with vehicle-treated hearts. Data are mean ± SEM. n=7–12 mice per group. *P<0.05 vs. Vehicle at 35 d.
Figure 7
Figure 7. Impact on myocardial capillary density
Panel A shows representative images of capillary profiles in the infarct zone, border zone, and nonischemic zone. Panel B shows quantitative myocardial capillary density. Data represent mean ± SEM. *P<0.05 vs. Vehicle. IZ, infarct zone; BZ, infarct border zone; NZ, nonischemic zone. Scale bar = 50 µm.
Figure 8
Figure 8. Impact on cardiomyocyte salvage and neoplastic growth
Viable myocyte area fraction in the infarct zone. Panels A–C illustrate representative examples of the infarct scar area in Masson’s trichrome-stained vehicle-treated (A), iPSC-treated (B), and iPSC-EV-treated (C) hearts. Scale bar = 50 µm. Quantitative data are presented in (D). Data are mean ± SEM. n=7–12 mice per group. *P<0.05 vs. Vehicle. Myocyte apoptosis. Panel E shows representative images from the infarct borderzone after TUNEL staining at 35 d after MI. Apoptotic nuclei (white arrows) are visualized by the green fluorescence. DAPI staining identifies nuclei in blue. Cardiac myocytes are positive for α-sarcomeric actin (red). Scale bar = 50 µm. Quantitative data are presented in panel F. Data represent mean ± SEM. *P<0.05 vs. Vehicle; #P<0.05 vs. iPSCs. IZ, infarct zone; BZ, borderzone; NZ, nonischemic zone. Panel G shows representative gross morphologies of tumors from two iPSC-injected hearts (upper images); photomicrographs from Masson’s trichrome-stained myocardial sections showing the variegated tissue composition of tumors (middle images, scale bar = 200 µm); and differentiation into ectodermal (neuroectoderm with pigment granules [arrows], lower left image), mesodermal (cartilage, lower middle image) and endodermal (respiratory epithelium with cilia [arrows], lower right image) lineages in H & E-stained sections from hearts harboring tumors. Scale bar = 50 µm.

Comment in

References

    1. Afzal MR, Samanta A, Shah ZI, Jeevanantham V, Abdel-Latif A, Zuba-Surma EK, Dawn B. Adult Bone Marrow Cell Therapy for Ischemic Heart Disease: Evidence and Insights From Randomized Controlled Trials. Circ Res. 2015;117:558–575. - PMC - PubMed
    1. Chimenti I, Smith RR, Li TS, Gerstenblith G, Messina E, Giacomello A, Marban E. Relative roles of direct regeneration versus paracrine effects of human cardiosphere-derived cells transplanted into infarcted mice. Circ Res. 2010;106:971–980. - PMC - PubMed
    1. Bobis-Wozowicz S, Kmiotek K, Sekula M, Kedracka-Krok S, Kamycka E, Adamiak M, Jankowska U, Madetko-Talowska A, Sarna M, Bik-Multanowski M, Kolcz J, Boruczkowski D, Madeja Z, Dawn B, Zuba-Surma EK. Human Induced Pluripotent Stem Cell-Derived Microvesicles Transmit RNAs and Proteins to Recipient Mature Heart Cells Modulating Cell Fate and Behavior. Stem Cells. 2015;33:2748–2761. - PubMed
    1. Thery C, Zitvogel L, Amigorena S. Exosomes: composition, biogenesis and function. Nat Rev Immunol. 2002;2:569–579. - PubMed
    1. Mulcahy LA, Pink RC, Carter DR. Routes and mechanisms of extracellular vesicle uptake. J Extracell Vesicles. 2014;3 - PMC - PubMed

Publication types

MeSH terms