. 2018 Jan 1;29(1):1-9.
doi: 10.1091/mbc.E17-01-0041. Epub 2017 Nov 8.

Regulation of ATP utilization during metastatic cell migration by collagen architecture

Affiliations

Regulation of ATP utilization during metastatic cell migration by collagen architecture

Matthew R Zanotelli et al. Mol Biol Cell. .

Abstract

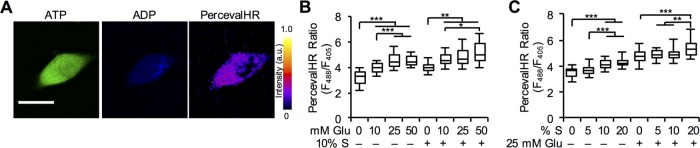
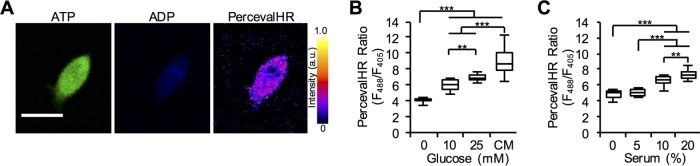
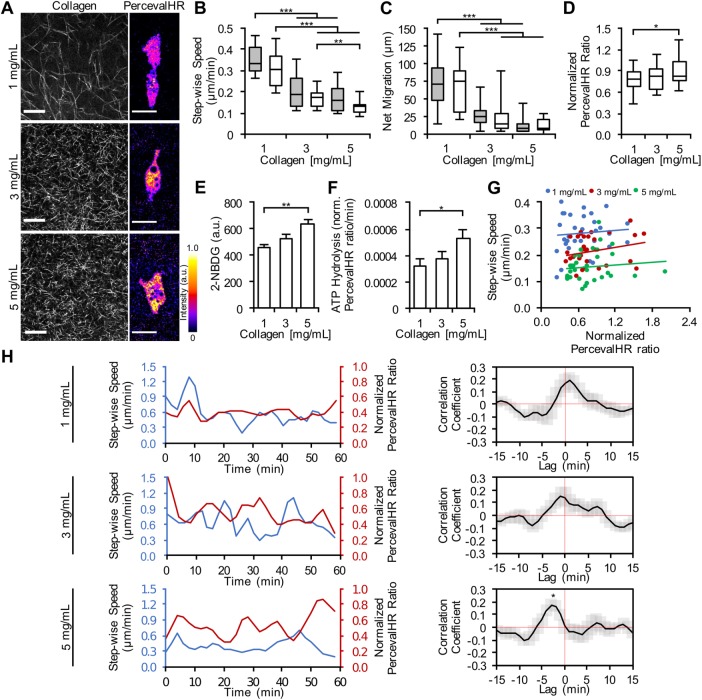
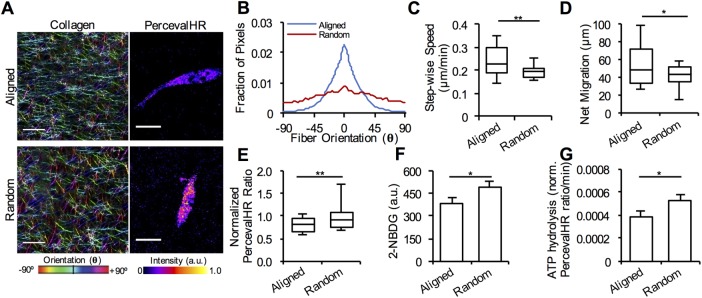
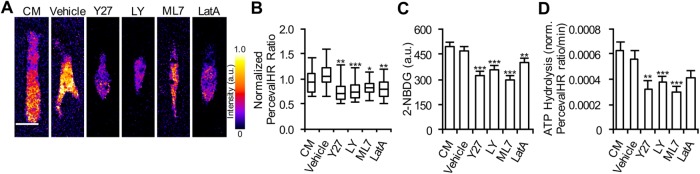
Cell migration in a three-dimensional matrix requires that cells either remodel the surrounding matrix fibers and/or squeeze between the fibers to move. Matrix degradation, matrix remodeling, and changes in cell shape each require cells to expend energy. While significant research has been performed to understand the cellular and molecular mechanisms guiding metastatic migration, less is known about cellular energy regulation and utilization during three-dimensional cancer cell migration. Here we introduce the use of the genetically encoded fluorescent biomarkers, PercevalHR and pHRed, to quantitatively assess ATP, ADP, and pH levels in MDA-MB-231 metastatic cancer cells as a function of the local collagen microenvironment. We find that the use of the probe is an effective tool for exploring the thermodynamics of cancer cell migration and invasion. Specifically, we find that the ATP:ADP ratio increases in cells in denser matrices, where migration is impaired, and it decreases in cells in aligned collagen matrices, where migration is facilitated. When migration is pharmacologically inhibited, the ATP:ADP ratio decreases. Together, our data indicate that matrix architecture alters cellular energetics and that intracellular ATP:ADP ratio is related to the ability of cancer cells to effectively migrate.


Figures

FIGURE 1:
FIGURE 1:
Cellular ATP response to glucose and serum in two-dimensional culture. (A) Representative MDA-MB-231 cells expressing PercevalHR in two-dimensional culture demonstrating the sensor bound to ATP (green), ADP (blue), and PercevalHR ratiometric signal. (B) Quantification of PercevalHR ratio response to increasing glucose levels in the presence of 0 and 10% serum in two-dimensional culture (n = 30 cells from three independent experiments). (C) Quantification of PercevalHR ratio response to increasing percentage of serum in the presence of 0 and 25 mM glucose in two-dimensional culture (n = 45 cells from three independent experiments). Box-and-whisker plots show medians and 25th/75th and 5th/95th percentiles. *p < 0.05, **p < 0.01, ***p < 0.001 for one-way ANOVA with Tukey’s HSD post-hoc test. Scale bar = 20 μm.
FIGURE 2:
FIGURE 2:
Cellular ATP response to glucose and serum in three-dimensional collagen matrices. (A) Representative MDA-MB-231 cells expressing PercevalHR in a 1.5 mg/ml three-dimensional collagen matrix demonstrating the sensor bound to ATP (green), ADP (blue), and PercevalHR ratiometric signal. (B) Quantification of PercevalHR ratio response to increasing glucose levels in the presence of 0% serum and complete media (CM; 25 mM glucose, 10% serum) in three-dimensional collagen gels (n ≥ 20 cells from three independent experiments). (C) Quantification of PercevalHR ratio in response to increasing serum levels in the presence of 0 mM glucose in three-dimensional collagen gels (n ≥ 13 cells from three independent experiments). Box-and-whisker plots show medians and 25th/75th and 5th/95th percentiles. **p < 0.01, ***p < 0.001 for one-way ANOVA with Tukey’s HSD post-hoc test. Scale bar = 20 μm.
FIGURE 3:
FIGURE 3:
Effect of matrix density on ATP:ADP ratio and cell migration in three-dimensional collagen matrices. (A) Confocal reflectance images of collagen gels and representative pH-corrected PercevalHR ratios of MDA-MB-231 cells coexpressing PercevalHR and pHRed cultured in a 1, 3, and 5 mg/ml three-dimensional collagen matrix. Quantification of cell (B) stepwise cell migration speed and (C) net migration for increasing collagen density when cultured in DMEM with 10% serum and 25 mM glucose (gray) or DMEM with 10% serum and 0 mM glucose (white) (n = 30 cells per treatment from three independent experiments). Quantification of (D) pH-corrected PercevalHR ratiometric signal, (E) 2-NBDG uptake, and (F) ATP hydrolysis rate of cells cultured in three-dimensional collagen matrices of varying density (n = [D] 30, [E] 45, [F] 30 cells from three independent experiments). (G) Stepwise speed and accompanying pH-corrected PercevalHR ratiometric signal of individual cells cultured in three-dimensional collagen matrices of varying density averaged across 12–18 h of culture. Each data point represents an individual cell (n = 33 cells from three independent experiments). (H) Stepwise speed and pH-corrected PercevalHR ratiometric signal and of an individual, migrating cell cultured in 1, 3, and 5 mg/ml 3D collagen matrices over 1 h, and comparison of corresponding temporal cross-correlation analysis between stepwise speed and normalized PercevalHR ratiometric signal at each matrix density (n = 20 cells from three independent experiments). Box-and-whisker plots show medians and 25th/75th and 5th/95th percentiles. Bars denote mean ± SEM. *p < 0.05, **p < 0.01, ***p < 0.001 for one-way ANOVA with Tukey’s HSD post-hoc test, and one-sample t test, which was used to determine the significance of lag for temporal cross-correlation comparison. Scale bars = 20 µm.
FIGURE 4:
FIGURE 4:
Reduction in ATP usage in cells cultured in three-dimensional collagen matrices with aligned fibers. (A) Confocal reflectance of an aligned and randomly oriented 1.5 mg/ml three-dimensional collagen matrix with representative pH-corrected PercevalHR ratios of MDA-MB-231 cells coexpressing PercevalHR and pHRed. Collagen is pseudo-colored corresponding to fiber angle. (B) Collagen fiber alignment in aligned and randomly oriented collagen matrices (n = 30 images from three independent experiments). Quantification of cell (C) stepwise cell migration speed and (D) net migration in aligned and random collagen matrices (n = 30 cells from three independent experiments). Quantification of (E) pH-corrected PercevalHR ratiometric signal, (F) 2-NBDG uptake, and (G) ATP hydrolysis of cells cultured in three-dimensional aligned and random collagen matrices (n = [E] 40, [F] 45, [G] 40 cells from three independent experiments). Box-and-whisker plots show medians and 25th/75th and 5th/95th percentiles. Bars denote mean ± SEM. *p < 0.05, **p < 0.01 for Wilcoxon rank test. Scale bars = 20 μm.
FIGURE 5:
FIGURE 5:
Reduction of ATP usage in cells by migration inhibition. (A) Representative pH-corrected PercevalHR ratios of MDA-MB-231 cells coexpressing PercevalHR and pHRed cultured in a 1.5 mg/ml collagen matrix treated with complete media (CM), vehicle control (DMSO), Y27632 (Y27), LY294002 (LY), ML7, and Latrunculin A (LatA). Quantification of (B) pH-corrected PercevalHR ratiometric signal, (C) 2-NBDG uptake, and (D) ATP hydrolysis for cells cultured in 1.5 mg/ml collagen matrices across inhibitor treatments (n = [B] 40, [C] 45, [D] 30 cells from three independent experiments). Box-and-whisker plots show medians and 25th/75th and 5th/95th percentiles. Bars denote mean ± SEM. *p < 0.05, **p < 0.01, ***p < 0.001 for Wilcoxon rank test for each condition compared with control (CM, complete media). Scale bar = 20 μm.

References

    1. Alberts B, Johnson A, Lewish J. Molecular Biology of the Cell. 4th ed. New York: Garland Science; 2002.
    1. Amano M, Nakayama M, Kaibuchi K. Rho-kinase/ROCK: a key regulator of the cytoskeleton and cell polarity. Cytoskeleton. 2010;67:545–554. - PMC - PubMed
    1. Berg J, Pun Hung Y, Yellen G. A genetically encoded fluorescent reporter of ATP/ADP ratio. Nat Methods. 2009;6:161–166. - PMC - PubMed
    1. Bergman J. ATP: the perfect energy currency for the cell. Creat Res Soc Q. 1999;36
    1. Bernstein BW, Bamburg JR. Actin-ATP hydrolysis is a major energy drain for neurons. J Neurosci. 2003;23:1–6. - PMC - PubMed

Publication types