. 2018 Jan 1;29(1):29-41.
doi: 10.1091/mbc.E17-06-0362. Epub 2017 Nov 8.

Translational control of a human CDKN1A mRNA splice variant regulates the fate of UVB-irradiated human keratinocytes

Affiliations

Translational control of a human CDKN1A mRNA splice variant regulates the fate of UVB-irradiated human keratinocytes

Ann E Collier et al. Mol Biol Cell. .

Abstract

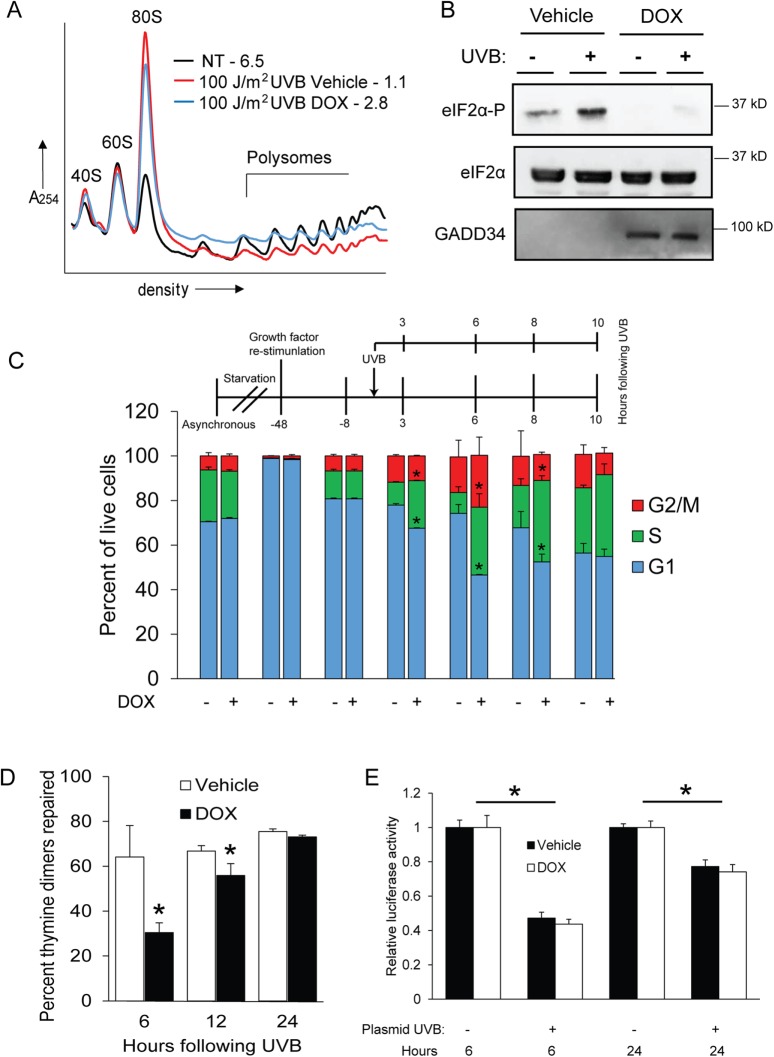
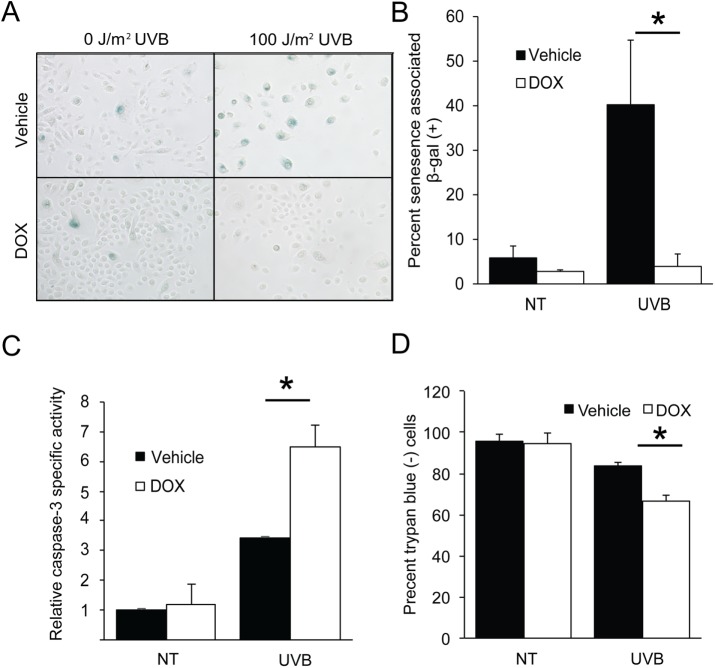
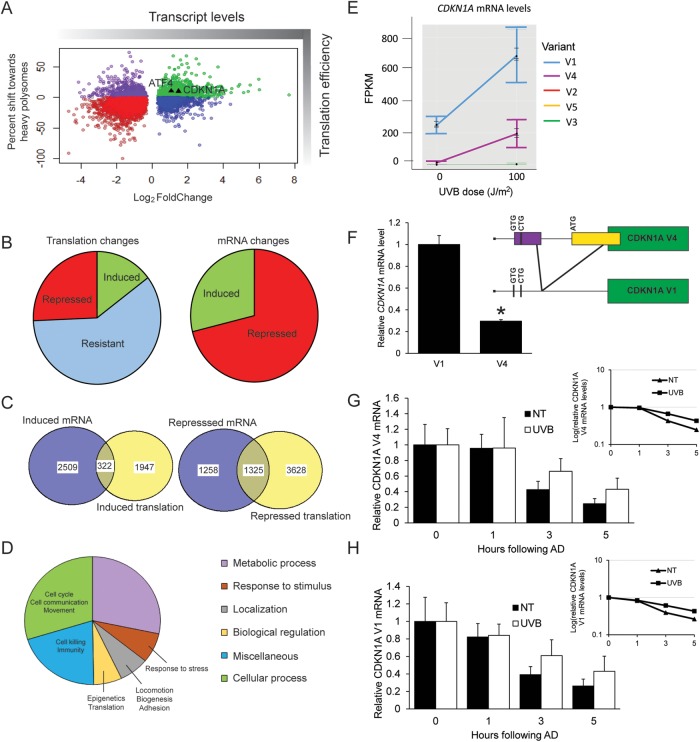
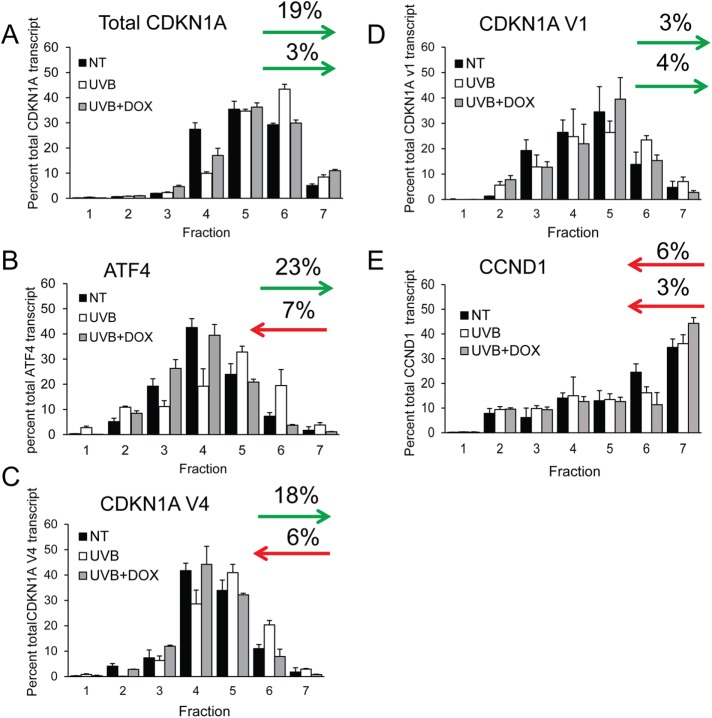
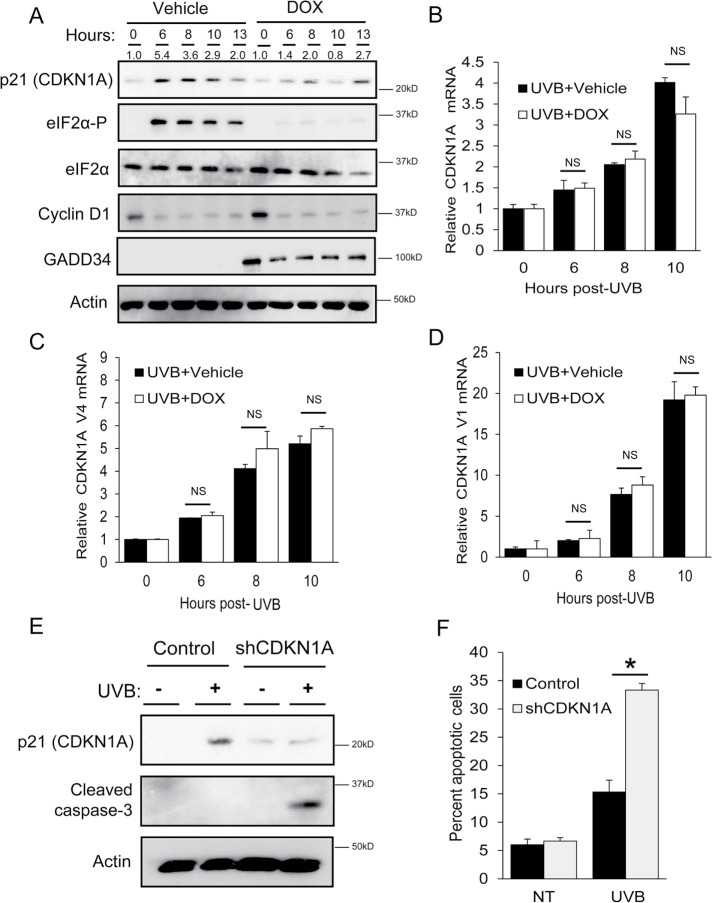
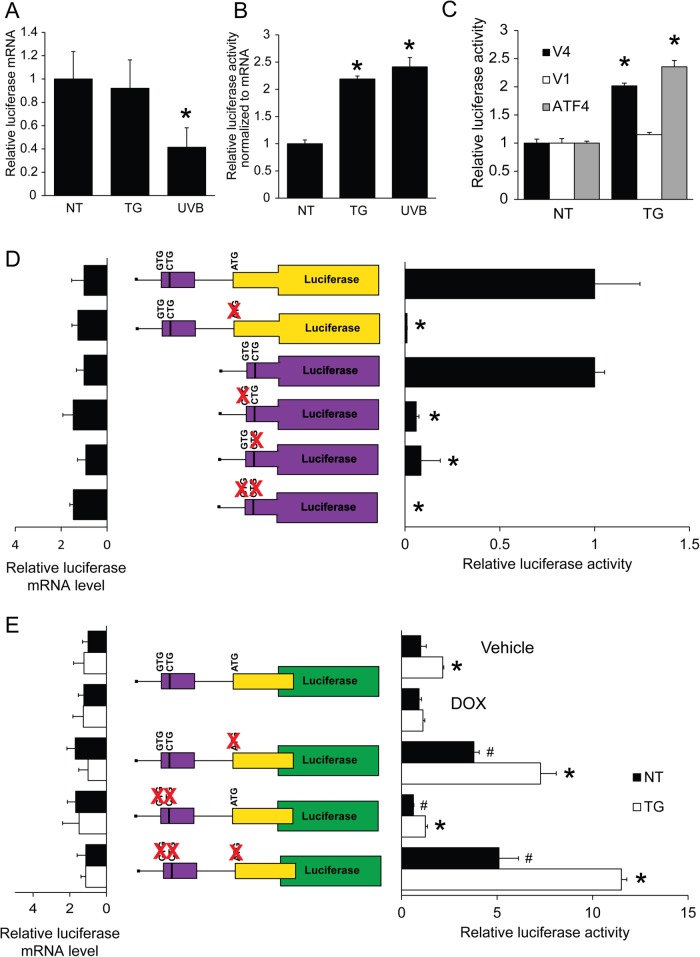
In response to sublethal ultraviolet B (UVB) irradiation, human keratinocytes transiently block progression of the cell cycle to allow ample time for DNA repair and cell fate determination. These cellular activities are important for avoiding the initiation of carcinogenesis in skin. Central to these processes is the repression of initiation of mRNA translation through GCN2 phosphorylation of eIF2α (eIF2α-P). Concurrent with reduced global protein synthesis, eIF2α-P and the accompanying integrated stress response (ISR) selectively enhance translation of mRNAs involved in stress adaptation. In this study, we elucidated a mechanism for eIF2α-P cytoprotection in response to UVB in human keratinocytes. Loss of eIF2α-P induced by UVB diminished G1 arrest, DNA repair, and cellular senescence coincident with enhanced cell death in human keratinocytes. Genome-wide analysis of translation revealed that the mechanism for these critical adaptive responses by eIF2α-P involved induced expression of CDKN1A encoding the p21 (CIP1/WAF1) protein. We further show that human CDKN1A mRNA splice variant 4 is preferentially translated following stress-induced eIF2α-P by a mechanism mediated in part by upstream ORFs situated in the 5'-leader of CDKN1A mRNA. We conclude that eIF2α-P is cytoprotective in response to UVB by a mechanism featuring translation of a specific splice variant of CDKN1A that facilitates G1 arrest and subsequent DNA repair.


Figures

FIGURE 1:
FIGURE 1:
Loss of eIF2α-P diminishes G1 arrest and DNA repair following UVB. Human N-TERT keratinocytes were treated with 100 J/m2 UVB in the absence or presence of DOX, which enhances GADD34 overexpression and diminishes eIF2α-P and the ISR. Alternatively, the cells were not subjected to treatment. (A) Lysates were prepared from the cells at 8 h post-UVB and subjected to polysome profiling. P/m values are indicated for each profile. (B) NTERT cells were subjected to vehicle or DOX to overexpress GADD34, followed by treatment with UVB (+) or no-stress treatment (–). Lysates were then prepared from the N-TERT cells and the indicated proteins were measured by immunoblot analysis. Protein size markers are indicated for each panel. (C) Cells were synchronized in G1 by a strategy highlighted in this panel, followed by irradiation with 100 J/m2 UVB. At the indicated times post-UVB treatment, cells were costained with EdU and PI to measure cell cycle phases via flow cytometry. Percentages of the indicated cell cycles are represented in the bar graphs. (D) Genomic DNA isolated from the synchronized cells was also subjected to immunoblot analysis to measure thymine dimer content. Cells were treated with UVB and then cultured for between 6 and 24 h in the presence of DOX to overexpress GADD34 or vehicle control. The DNA repair rate is represented as a percent decrease in thymine dimers compared with those in cells 15 min after UVB treatment. (E) A host-cell reactivation assay was performed at the indicated times posttransfection by measuring luciferase activity expressed from plasmid DNA that was treated with UVB (+) or no irradiation (-) prior to transfection into N-TERT cells. The N-TERT cells were cultured and treated with DOX to overexpress GADD34 or vehicle control for 6 or 24 h. Cells were lysed and assayed for luciferase activity. * indicates p < 0.05. Error bars represent mean ± SD of three separate experiments.
FIGURE 2:
FIGURE 2:
Loss of eIF2α-P switches cell fate away from senescence and toward apoptosis following UVB. (A) N-TERT keratinocytes were treated with 0 or 100 J/m2 UVB and maintained in culture for 72 h. Cells were then fixed and stained for senescence-associated β-galactosidase activity. Quantification of senescent cells (dark blue) is indicated in B. Alternatively, cells were collected 6 h post-UVB and assayed for (C) caspase-3 specific activity or (D) trypan blue to measure loss of cells. Error bars represent mean ± SD of three separate experiments, and * indicates p < 0.05.
FIGURE 3:
FIGURE 3:
Genome-wide analyses reveal preferential translation of CDKN1A following UVB. N-TERT keratinocytes were irradiated with 0 or 100 J/m2 UVB, followed by lysate preparation and polysome profiling. RNA was isolated from total cell lysate and light or heavy polysome fractions, and each was analyzed by RNA-Seq. (A) Scatterplot illustrating the shift toward heavy polysomes vs. relative mRNA fold changes following UVB irradiation. Only genes with significant mRNA fold changes (p < 0.05) are shown. (B) On the left side of the panel is a pie chart indicating the numbers of genes whose translation was induced (>10% shift), resistant (between -10% and 10% shift), or repressed (less than -10% shift) following UVB irradiation. On the right side of the panel is the number of genes whose transcripts were significantly induced or repressed after UVB treatment. (C) Venn diagram comparing the gene transcripts with significantly induced mRNA following UVB treatment and those genes that are subject to induced translation, as judged by a >10% shift of the encoded mRNAs toward large polysomes. Additionally, a Venn diagram is featured showing those gene transcripts that were significantly repressed following UVB irradiation, along with those genes displaying translation repression (>10% shift toward small polysomes). (D) Pie chart illustrating the different cellular functions of genes that are suggested to be preferentially translated in response to UVB. (E) FPKM values to indicate relative expression level for each CDKN1A transcript variant after the indicated UVB dose. (F) Pattern of alternative splicing of the CDKN1A, leading to V1 and V4 transcripts that display the uORFs and coding sequences (green boxes). Potential initiation codons are illustrated in the 5′-leader of the V1 transcript. Primers that recognize both V1 and V4 were used to perform PCR on N-TERT keratinocytes to determine relative transcript abundance. Bands were quantified by densitometry and normalized to PCR product size. N-TERTs were exposed to 0 or 100 J/m2 UVB, and after 8 h, RNA was prepared from the cells for measurement of V4 (G) and V1 (H) mRNAs by qPCR. Additionally, cells were treated with 10 μM actinomycin D (AD) and cultured for an additional 1, 3, or 5 h, and levels of the V1 and V4 mRNAs were determined to assess the rate of decay for these transcripts. Transcript levels were measured in no treatment (NT) or UVB exposed cells following actinomycin treatments were normalized to the respective cells measured in the absence of actinomycin D treatment (0). A semilog plot of each decay rate is shown in the inset plot for each transcript. Error bars represent mean ± SD of three biological replicates. * indicates p < 0.05.
FIGURE 4:
FIGURE 4:
Human CDKN1A splice variant 4 is preferentially translated following UVB. N-TERT cells were irradiated with 0 or 100 J/m2 UVB in the presence or absence of DOX to trigger depletion of eIF2α-P and the ISR. Cells were collected 8 h following UVB treatment and lysates were prepared and analyzed by polysome profiling. The amounts of the CDKN1A (A), ATF4 (B), CDKN1A V4 (C), CDKN1A V1 (D), and CCND1 (E) mRNAs in the indicated sucrose gradient fractions were measured by qPCR. Levels of the gene transcripts in each fraction are represented as a percentage of the total gene transcript to discount any changes in the specific mRNA levels. Arrows represent the percent of each transcript that shifts toward or away from heavy polysomes (fractions 5–7). For each panel, the top arrow indicates the shift toward heavy polysomes in response to UVB, whereas the bottom arrow is in response to UVB and DOX treatment. Error bars represent mean ± SD of three separate experiments.
FIGURE 5:
FIGURE 5:
Phosphorylation of eIF2α is required for induced expression of p21 protein following UVB. N-TERT keratinocytes were treated with either vehicle or DOX to induce overexpression of GADD34 and diminish eIF2α-P, followed by exposure to 0 or 100 J/m2 UVB. (A) Lysates were collected from cells at the indicated times following UVB treatment and then subjected to immunoblot analyses to measure the indicated proteins. Sizes of protein markers are indicated to the right of the panels. Additionally, qPCR was used to measure (B) total CDKN1A, (C) V4, or (D) V1 mRNAs in the N-TERT cells. To determine the effects of CDKN1A loss on cell death, control and CDKN1A knockdown N-TERTs were irradiated with 0 or 100 J/m2 UVB. Lysates were collected 8 h following the UVB treatment and subjected to (E) immunoblot analysis to measure cleavage of caspase 3 or (F) PI staining to measure DNA content and relative cell death. * indicates p < 0.05. Error bars represent mean ± SD of three separate experiments.
FIGURE 6:
FIGURE 6:
The 5′-leader of CDKN1A V4 mRNA directs preferential translation in response to eIF2α-P. N-TERTs were transfected with a CDKN1A V4 luciferase reporter followed by treatment with TG or 100 J/m2 UVB, as indicated. Measurements of (A) mRNA and (B) luciferase reporter activity are represented as histograms. (C) Translational control was determined for V4 and V1 variants of CDKN1A or an ATF4 luciferase in response to 6 h of treatment with TG. Firefly luciferase activity was determined using a dual luciferase assay. (D) N-TERTs were transfected with the depicted reporter plasmids encoding the indicated uORFs fused with the firefly luciferase CDS. Luciferase activity was measured after 24 h of transfection. (E) Wild type and the indicated mutant versions of the CDKN1A V4 reporter were transfected into N-TERT cells, followed by treatment with TG for 6 h. Firefly luciferase activity was measured using the dual luciferase assay. Relative amounts of luciferase reporter mRNA as measured by qPCR are shown to the left in D and E. The red “x” indicates mutations of the putative indication codons. * indicates p < 0.05 and # indicates p < 0.05 compared with the untreated reporter. Error bars represent mean ± SD of three separate experiments.

References

    1. Abbas T, Dutta A. p21 in cancer: intricate networks and multiple activities. Nat Rev Cancer. 2009;9:400–414. - PMC - PubMed
    1. Baird TD, Palam LR, Fusakio ME, Willy JA, Davis CM, McClintick JN, Anthony TG, Wek RC. Selective mRNA translation during eIF2 phosphorylation induces expression of IBTKalpha. Mol Biol Cell. 2014;25:1686–1697. - PMC - PubMed
    1. Baird TD, Wek RC. Eukaryotic initiation factor 2 phosphorylation and translational control in metabolism. Adv Nutr. 2012;3:307–321. - PMC - PubMed
    1. Boyce M, Bryant KF, Jousse C, Long K, Harding HP, Scheuner D, Kaufman RJ, Ma D, Coen DM, Ron D, Yuan J. A selective inhibitor of eIF2alpha dephosphorylation protects cells from ER stress. Science. 2005;307:935–939. - PubMed
    1. Brugarolas J, Chandrasekaran C, Gordon JI, Beach D, Jacks T, Hannon GJ. Radiation-induced cell cycle arrest compromised by p21 deficiency. Nature. 1995;377:552–557. - PubMed

Publication types

MeSH terms

Substances