. 2018 Jan 1;78(1):143-156.
doi: 10.1158/0008-5472.CAN-17-0240. Epub 2017 Nov 8.

Complement Activation via a C3a Receptor Pathway Alters CD4+ T Lymphocytes and Mediates Lung Cancer Progression

Affiliations

Complement Activation via a C3a Receptor Pathway Alters CD4+ T Lymphocytes and Mediates Lung Cancer Progression

Jeff W Kwak et al. Cancer Res. .

Abstract

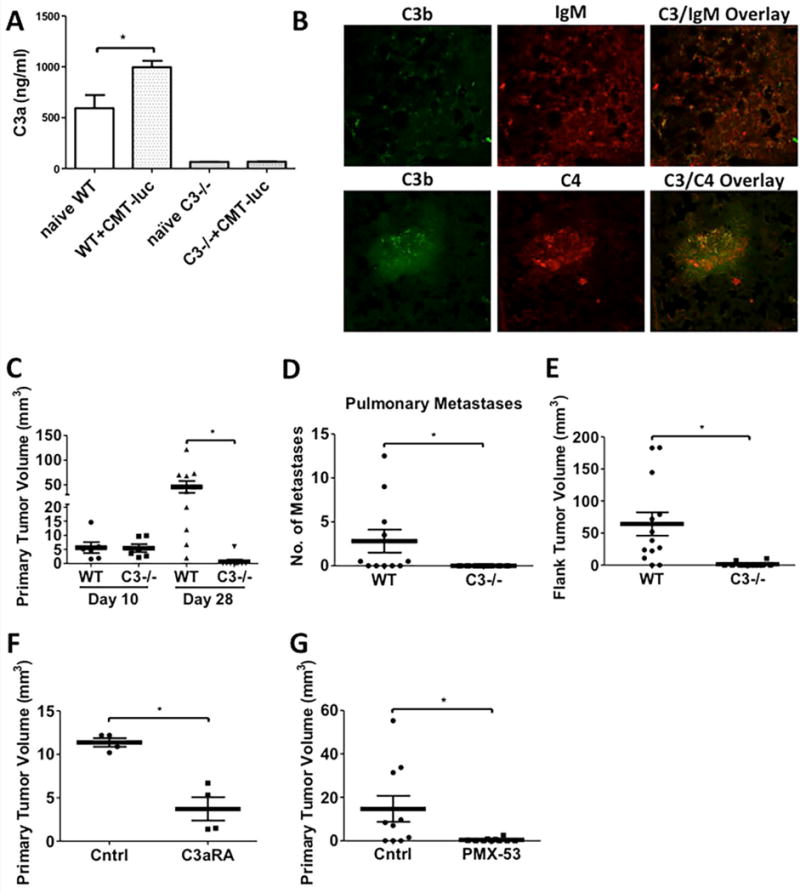
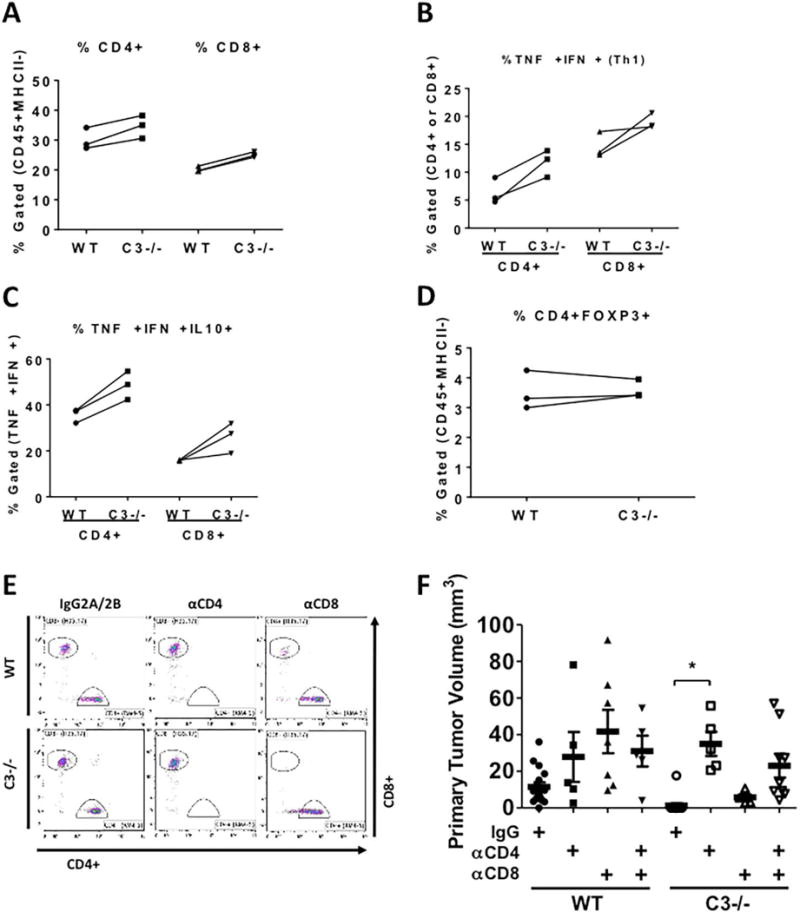
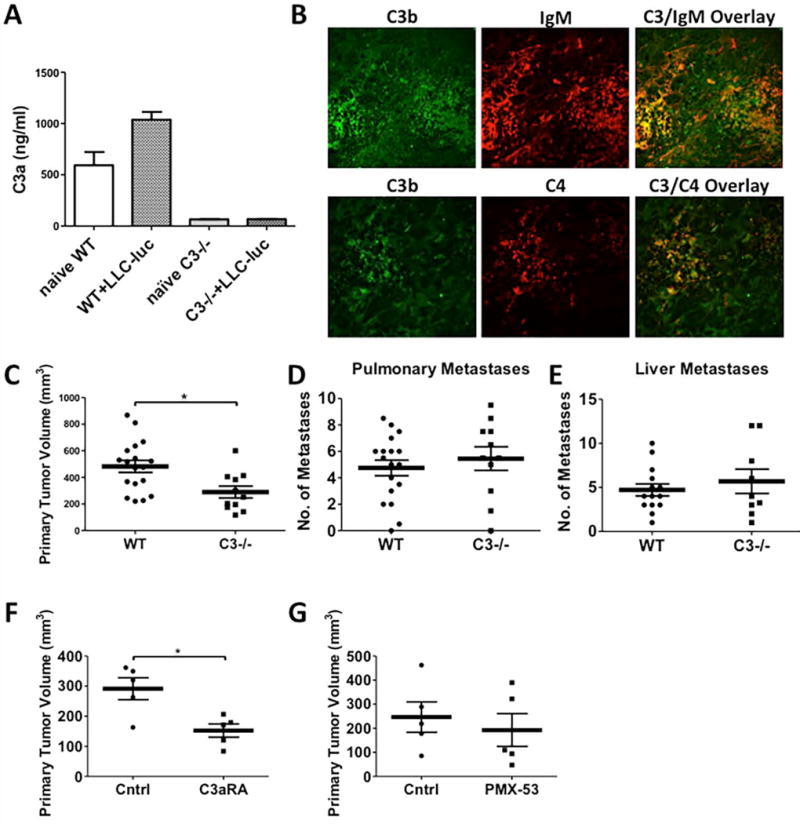
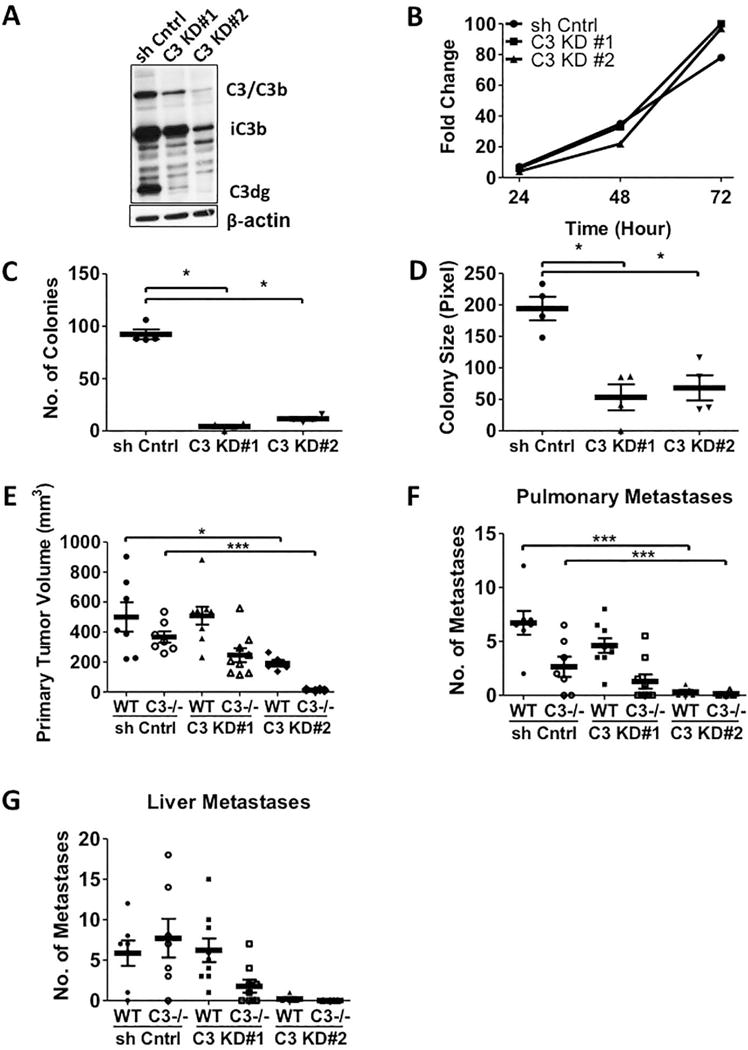
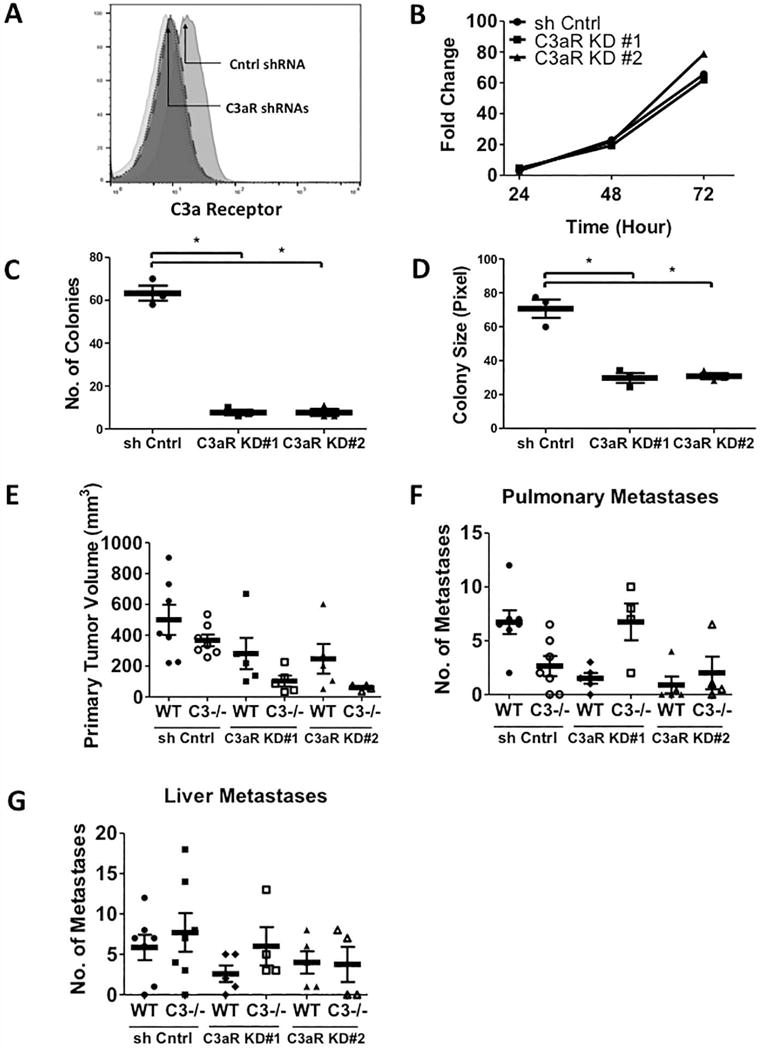
The complement cascade is a part of the innate immune system that acts primarily to remove pathogens and injured cells. However, complement activation is also peculiarly associated with tumor progression. Here we report mechanistic insights into this association in multiple immunocompetent orthotopic models of lung cancer. After tumor engraftment, we observed systemic activation of the complement cascade as reflected by elevated levels of the key regulator C3a. Notably, growth of primary tumors and metastases was both strongly inhibited in C3-deficient mice (C3-/- mice), with tumors undetectable in many subjects. Growth inhibition was associated with increased numbers of IFNγ+/TNFα+/IL10+ CD4+ and CD8+ T cells. Immunodepletion of CD4+ but not CD8+ T cells in tumor-bearing subjects reversed the inhibitory effects of C3 deletion. Similarly, antagonists of the C3a or C5a receptors inhibited tumor growth. Investigations using multiple tumor cell lines in the orthotopic model suggested the involvement of a C3/C3 receptor autocrine signaling loop in regulating tumor growth. Overall, our findings offer functional evidence that complement activation serves as a critical immunomodulator in lung cancer progression, acting to drive immune escape via a C3/C5-dependent pathway.Significance: This provocative study suggests that inhibiting complement activation may heighten immunotherapeutic responses in lung cancer, offering findings with immediate implications, given the existing clinical availability of complement antagonists. Cancer Res; 78(1); 143-56. ©2017 AACR.


Figures

Figure 1
Figure 1. Inhibition of CMT-luc Tumor Growth in C3−/− mice
Age matched WT and C3−/− mice were injected with CMT-luc tumors, and the primary tumors, organs, and whole blood were collected at the terminal sacrifice 28 days post-injection. (A) ELISA specific for murine C3a was used to measure C3a in the plasma samples collected from naïve or tumor-bearing WT and C3−/− mice (Naïve WT n = 3; WT+CMT-luc n = 5; naïve C3−/− n = 4; C3−/−+CMT-luc n = 9). (B) Immunofluorescence co-staining for C3 (green) and IgM (red) or C3 (green) and C4 (red) in the primary tumor specimens from WT mice were evaluated by confocal microscopy. (C) Primary tumor volumes 10 or 28 days after CMT-luc implantation in WT or C3−/− mice are shown. (Day 10: WT n = 6 and C3−/− n = 6; Day 28: WT n = 10 and C3−/− n = 9) (D) Number of metastases to the secondary pulmonary space were counted from ex vivo images that captured the luciferase activities of CMT-luc metastases. (WT n = 11; C3−/− n = 9) (E) Flank tumor volumes 28 days after CMT-luc implantation in WT or C3−/− are shown (WT n = 31; Day 28 C3−/− n = 12) (F-G) WT mice are administered with (F) C3a receptor antagonist (C3aRA; SB290157) or (G) PMX-53 (C5a receptor antagonist, C5aRA), starting a day prior to tumor implantation into WT mice. Primary tumor volumes 28 days after tumor implantation in the treated groups and vehicle or control peptide group are shown (F, n = 4 and G, n = 10 each group). *p <0.05. Error bars represent mean ± SEM.
Figure 2
Figure 2. Tumor Growth Inhibition in C3−/− mice is mediated through CD4+ Lymphocytes
CMT-luc cells were injected into the lungs of WT or C3−/− mice 10 days prior to flow cytometric analysis of the immune populations using the sequential flow cytometry gating strategy shown in Supplemental Figure 2C. (A–D) Three individual experiments using separate isolations of T cells from 3 WT or C3−/− mice are shown. (A) The percentages of CD4+ or CD8+ cells are shown within the tumor-bearing lungs of WT and C3−/− mice. (B) CD4+ and CD8+ populations were analyzed for their ability to make TNFα and IFNγ after in vitro stimulation. (C) The TNFα+ and IFNγ+ CD4+ or CD8+ cells were gated for their ability to produce IL-10. (D) The percentages of CD4+ FOXP3+ (Tregs) are shown in both groups. (E) Representative flow cytometric plots of depletion efficacy measured with CD8 antibody clone (H35.17) and CD4 antibody (RM4-5) are shown (n = 2). The percentages of depleted T cells are shown in Supplementary Table 1. (F) The effects of in vivo depletion of CD4- and CD8- specific T cells on the primary CMT-luc volumes are shown (WT+IgG n = 16; WT+αCD4 n = 5; WT+αCD8 n = 7; WT+αCD4+αCD8 n = 5; C3−/−+IgG n = 14; C3−/−+αCD4 n = 5; C3−/−+αCD8 n = 5; C3−/−+αCD4+αCD8 n = 9). The depletion antibodies were administered starting a week before the tumor implantation, and CMT-luc tumors were harvested 3 weeks after implantation. *p <0.05. Error bars represent mean ± SEM
Figure 3
Figure 3. Inhibition of LLC-luc Tumor Growth in C3−/− mice
Age and gender-matched WT and C3−/− mice were injected with LLC-luc tumors, and primary tumors, organs, and whole blood were collected at the terminal sacrifice 21 days post-injection. (A) ELISA specific for murine C3a was used to measure C3a in the plasma samples collected from naïve or LLC-luc tumor-bearing WT and C3−/− mice (Naïve WT n = 3; WT+LLC-luc n = 21; naïve C3−/− n = 4; C3−/−+LLC-luc n = 4). Same data from naïve WT and C3−/− mice are used in this graph. (B) Immunofluorescence co-staining for C3 (green) and IgM (red) or C3 (green) and C4 (red) in tumor specimens induced by LLC-luc from C3−/− were evaluated by confocal microscopy. (C) Primary tumor volumes 21 days after LLC-luc implantation in WT or C3−/− mice are shown (WT n = 18; C3−/− n = 11). (D and E) Number of metastases to the secondary pulmonary space and liver were counted from ex vivo images that captured the luciferase activities of LLC-luc metastases (Pulmonary metastasis - WT n = 18; C3−/− n = 11 and Liver metastasis - WT n = 14; C3−/− n = 9). (F-G) WT mice are administered with (F) C3a receptor antagonist (C3aRA; SB290157) or (G) PMX-53 (C5a receptor antagonist, C5aRA), starting a day prior to tumor implantation into WT mice. Primary tumor volumes 21 days after tumor implantation in both treated groups and vehicle or control peptide group are shown (F, n = 5 and G, n = 5 each group). *p <0.05. Error bars represent mean ± SEM.
Figure 4
Figure 4. Silencing C3 Expression in LLC-luc Cells Inhibits Tumor Progression in vivo
(A) Western blot analysis of the whole cell lysates from LLC-luc cells transduced with two lentiviral shRNA constructs targeting C3 are shown. The anti-C3d antibody that recognizes C3 activation fragments is used. (B) Fold changes in vitro proliferation of two C3 knockdown LLC-luc cell lines are shown. (C and D) Numbers and sizes of C3 KD LLC-luc colonies are shown in the anchorage independent assay (n = 4). (E-G) The primary tumor volumes and number of metastases induced by the two C3 KD LLC-luc cell lines and the control shRNA cell lines are shown. The animals were sacrificed 21 days after the tumor implantation (WT+sh cntrl n = 7; C3−/−+sh cntrl n = 7; WT+C3 KD#1 n = 9; C3−/−+C3 KD#1 n = 9; WT+C3 KD#2 n = 5; C3−/−+C3 KD#2 n =4). * p<0.05 *** p<0.001. Error bars represent mean ± SEM.
Figure 5
Figure 5. Silencing C3a Receptor Expression in LLC-luc Cells Inhibits the Primary Tumor Growth, but not metastasis in vivo
(A) Flow cytometric analysis of cell surface C3a receptor expression on the two C3a receptor knockdown and control LLC-luc cell lines. (Isotype in light grey (median = 9.10); LLC-luc shRNA control on grey (median = 19.8); LLC-luc C3aR KD#1 in dark grey with small dotted line (median = 9.87); LLC-luc C3aR KD#2 in dark grey with big dotted line (median = 10.5)). (B) Fold changes in vitro proliferation of two C3aR knockdown LLC-luc cell lines are shown. (C and D) Numbers and sizes of C3aR KD LLC-luc colonies are shown in the anchorage independent assay. (E-G) The primary tumor volumes (E) and number of pulmonary (F) and liver (G) metastases induced by the two C3aR KD LLC-luc cell lines and the control shRNA cell lines are shown. The animals were sacrificed 21 days after the tumor implantation. (WT+C3aR KD#1 n = 5; C3−/−+C3aR KD#1 n = 5; WT+C3aR KD#2 n = 5; C3−/−+C3aR KD#2 n =4). * p<0.05 Error bars represent mean ± SEM.
Figure 6
Figure 6. Immunostaining of Human Lung Tumors
Tissue microarrays containing human lung adenocarcinomas were obtained from the Tissue Bank of the SPORE in Lung Cancer at the University of Colorado and stained for C3d (yellow), IgM (red), and dapi (blue). (A) C3d and IgM positivity was determined in a blinded fashion by examination of tissue punches following background subtraction in each individual channel. Tissue punches were considered positive when signal could be observed in ≥ 5% of the total punch. Each adenocarcinoma was represented by 3 randomly placed punches, and was considered positive when signal could be detected in all represented punches. The histogram shows the frequency and number that were scored double positive (C3d+/IgM+ in yellow), single positive (C3d+/IgM− in green or C3d−/IgM+ in red) or negative both markers (C3d−/IgM− in grey) out of total of 55 patient samples. (B) Two representative staining of C3d+/IgM+ are shown in x4. Areas of IgM and C3d co-deposition within the adenocarcinomas are shown in 20x (arrows). (C) Representative staining of C3d−/IgM+ is shown on the top panels and C3d+/IgM− on the bottom panels. Scale bars = 200 µm.

Comment in

References

    1. Hollenberg NK. Hypertension and the kidney: determinants of the response to antihypertensive therapy and their implications. Am Heart J. 1993;125:604–8. - PubMed
    1. Gettinger SN, Horn L, Gandhi L, Spigel DR, Antonia SJ, Rizvi NA, Powderly JD, Heist RS, Carvajal RD, Jackman DM, Sequist LV, Smith DC, Leming P, Carbone DP, Pinder-Schenck MC, Topalian SL, Hodi FS, Sosman JA, Sznol M, McDermott DF, Pardoll DM, Sankar V, Ahlers CM, Salvati M, Wigginton JM, Hellmann MD, Kollia GD, Gupta AK, Brahmer JR. Overall Survival and Long-Term Safety of Nivolumab (Anti-Programmed Death 1 Antibody, BMS-936558, ONO-4538) in Patients With Previously Treated Advanced Non-Small-Cell Lung Cancer. J Clin Oncol. 2015;33:2004–12. - PMC - PubMed
    1. Sundar R, Soong R, Cho BC, Brahmer JR, Soo RA. Immunotherapy in the treatment of non-small cell lung cancer. Lung Cancer. 2014;85:101–9. - PMC - PubMed
    1. Oner F, Savas I, Numanoglu N. Immunoglobulins and complement components in patients with lung cancer. Tuberk Toraks. 2004;52:19–23. - PubMed
    1. Ricklin D, Hajishengallis G, Yang K, Lambris JD. Complement: a key system for immune surveillance and homeostasis. Nature immunology. 2010;11:785–97. 2924908. - PMC - PubMed

Publication types

MeSH terms