

Illuminating Neural Circuits: From Molecules to MRI
- PMID: 29118210
- PMCID: PMC5678014
- DOI: 10.1523/JNEUROSCI.2569-17.2017
Illuminating Neural Circuits: From Molecules to MRI
Abstract
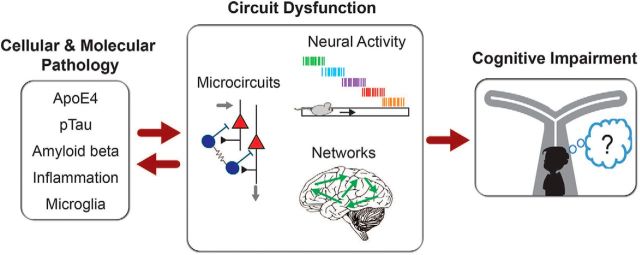
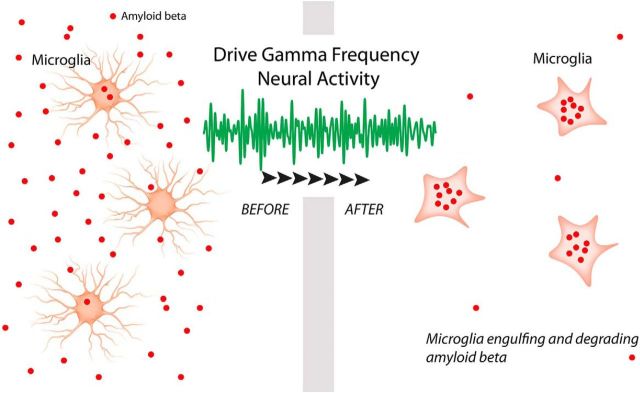
Neurological disease drives symptoms through pathological changes to circuit functions. Therefore, understanding circuit mechanisms that drive behavioral dysfunction is of critical importance for quantitative diagnosis and systematic treatment of neurological disease. Here, we describe key technologies that enable measurement and manipulation of neural activity and neural circuits. Applying these approaches led to the discovery of circuit mechanisms underlying pathological motor behavior, arousal regulation, and protein accumulation. Finally, we discuss how optogenetic functional magnetic resonance imaging reveals global scale circuit mechanisms, and how circuit manipulations could lead to new treatments of neurological diseases.
Keywords: Alzheimer's disease; arousal; basal ganglia; gamma frequency; ofMRI; optogenetics.
Copyright © 2017 the authors 0270-6474/17/3710817-09$15.00/0.
Figures


Similar articles
-
Informing brain connectivity with optogenetic functional magnetic resonance imaging.Neuroimage. 2012 Oct 1;62(4):2244-9. doi: 10.1016/j.neuroimage.2012.01.116. Epub 2012 Feb 3. Neuroimage. 2012. PMID: 22326987 Review.
-
Studying Brain Circuit Function with Dynamic Causal Modeling for Optogenetic fMRI.Neuron. 2017 Feb 8;93(3):522-532.e5. doi: 10.1016/j.neuron.2016.12.035. Epub 2017 Jan 26. Neuron. 2017. PMID: 28132829 Free PMC article.
-
Contemporary approaches to neural circuit manipulation and mapping: focus on reward and addiction.Philos Trans R Soc Lond B Biol Sci. 2015 Sep 19;370(1677):20140210. doi: 10.1098/rstb.2014.0210. Philos Trans R Soc Lond B Biol Sci. 2015. PMID: 26240425 Free PMC article. Review.
-
Illuminating Neural Circuits in Alzheimer's Disease.Neurosci Bull. 2021 Aug;37(8):1203-1217. doi: 10.1007/s12264-021-00716-6. Epub 2021 Jun 5. Neurosci Bull. 2021. PMID: 34089505 Free PMC article. Review.
-
Optogenetic Functional MRI.J Vis Exp. 2016 Apr 19;(110):53346. doi: 10.3791/53346. J Vis Exp. 2016. PMID: 27167840 Free PMC article.
Cited by
-
Building bridges: simultaneous multimodal neuroimaging approaches for exploring the organization of brain networks.Neurophotonics. 2022 Jul;9(3):032202. doi: 10.1117/1.NPh.9.3.032202. Epub 2022 Sep 23. Neurophotonics. 2022. PMID: 36159712 Free PMC article. Review.
-
Human brain development through the lens of cerebral organoid models.Brain Res. 2019 Dec 15;1725:146470. doi: 10.1016/j.brainres.2019.146470. Epub 2019 Sep 19. Brain Res. 2019. PMID: 31542572 Free PMC article. Review.
-
Optogenetic fMRI for Brain-Wide Circuit Analysis of Sensory Processing.Int J Mol Sci. 2022 Oct 14;23(20):12268. doi: 10.3390/ijms232012268. Int J Mol Sci. 2022. PMID: 36293125 Free PMC article.
-
Frontostriatal regulation of brain circuits contributes to flexible decision making.Neuropsychopharmacology. 2025 Jun;50(7):1156-1166. doi: 10.1038/s41386-025-02065-8. Epub 2025 Feb 14. Neuropsychopharmacology. 2025. PMID: 39953208 Free PMC article.
-
Developing Precision Invasive Neuromodulation for Psychiatry.J Neuropsychiatry Clin Neurosci. 2021 Summer;33(3):201-209. doi: 10.1176/appi.neuropsych.20100268. Epub 2021 May 14. J Neuropsychiatry Clin Neurosci. 2021. PMID: 33985346 Free PMC article.
References
-
- Adams ZM, Forgacs PB, Conte MM, Nauvel TJ, Drover JD, Schiff ND (2016) Late and progressive alterations of sleep dynamics following central thalamic deep brain stimulation (CT-DBS) in chronic minimally conscious state. Clin Neurophysiol 127:3086–3092. 10.1016/j.clinph.2016.06.028 - DOI - PMC - PubMed
Publication types
MeSH terms
Grants and funding
LinkOut - more resources
Full Text Sources
Other Literature Sources
Medical