Review
. 2017 Nov 8;37(45):10894-10903.
doi: 10.1523/JNEUROSCI.1839-17.2017.

Nonhuman Primate Optogenetics: Recent Advances and Future Directions

Affiliations
Review

Nonhuman Primate Optogenetics: Recent Advances and Future Directions

Adriana Galvan et al. J Neurosci. .

Abstract

Optogenetics is the use of genetically coded, light-gated ion channels or pumps (opsins) for millisecond resolution control of neural activity. By targeting opsin expression to specific cell types and neuronal pathways, optogenetics can expand our understanding of the neural basis of normal and pathological behavior. To maximize the potential of optogenetics to study human cognition and behavior, optogenetics should be applied to the study of nonhuman primates (NHPs). The homology between NHPs and humans makes these animals the best experimental model for understanding human brain function and dysfunction. Moreover, for genetic tools to have translational promise, their use must be demonstrated effectively in large, wild-type animals such as Rhesus macaques. Here, we review recent advances in primate optogenetics. We highlight the technical hurdles that have been cleared, challenges that remain, and summarize how optogenetic experiments are expanding our understanding of primate brain function.

Keywords: NHP; monkey; opsins; optogenetic; optrode; promoter.


Figures

Figure 1.
Figure 1.
Recent advances in NHP optogenetics. Shown is a schematic outline of the macaque brain indicating the regions and pathways that are the focus of recent studies that use optogenetics. Colored ovals represent different brain nuclei and arrows represent connections between areas. M1, Primary motor cortex; FEF, Frontal eye field; LGN, lateral geniculate nucleus; SC, superior colliculus; MThal, Motor thalamus; SNc/VTA, substantia nigra pars compacta/ventral tegmental area; OMV, oculomotor vermis.
Figure 2.
Figure 2.
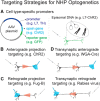
Methods to achieve selective optogenetic control of specific neuronal populations. A, Cell type specific-promoters. Left, Example AAV plasmid (but LVs were used as well). Dark blue, cyan, and green regions represent the normal positions of the promoter, opsin gene, and reporter gene, respectively. Gray regions of the plasmid represent standard AAV plasmid components and posttranslational enhancers. For more information, the reader is referred to https://www.addgene.org/viral-vectors/aav/aav-guide/. Right, AAVs injected into the brain region of interest infect cells nearby and the recombinant DNA normally remains episomal as circular DNA. Transcription of the recombinant DNA and subsequent opsin expression proceeds only in cells where the promoter is actively used (e.g., the L7 promoter in cerebellar Purkinje cells), allowing for a cell type specific optogenetic manipulation. B, Anterograde projection targeting. The viral vector, normally carrying a ubiquitous promoter (e.g., CMV), is injected into a particular brain region. As the opsin is expressed, it will be trafficked to the cell axons. The viral vector will infect cells in the injected region, but light is only delivered at a distant projection zone of some cell bodies at the injection site. Therefore, only the cells that project from the injected site to the illuminated region are activated. C, Retrograde projection targeting. Specialized viral vectors that are trafficked in the retrograde direction (e.g., rAAV2-retro, Fug-B) are injected in a brain region. The vector particles that enter axon terminals are transported back to the cell bodies, where transcription of the recombinant DNA occurs. Light is delivered to the cell bodies that project to the injected site. Therefore, only the cells that project from the illuminated region to the injected regions are activated. D, Transsynaptic projection targeting. Specialized proteins (e.g., WGA-Cre) and viruses (e.g., rabies, HSV) cross the synaptic cleft. Synaptic crossing occurs in the anterograde (top) or retrograde (bottom) direction, depending on the protein/virus used. Red arrows in BD indicate the direction of transport.
Figure 3.
Figure 3.
Cell type specific promoters direct expression of opsins in dopaminergic neurons and Purkinje cells in macaques. A, Expression of ChR2-EYFP (left) and TH (indicating dopaminergic neurons; middle). The majority of ChR2-EYFP-positive cells are also TH-positive, as indicated by white arrows. Yellow arrow indicates a rare example of nonspecific labeling. B, Expression of ChR2-mCherry (red) is restricted to calbindin-positive (green) neurons. Calbindin is a reliable marker of cerebellar Purkinje cells. The region within the white square is shown at a higher magnification in C. Scale bars: A, 0.1 mm; B, 1 mm; C, 0.2 mm. Reproduced with permission from Stauffer et al. (2016) (A) and El-Shamayleh et al. (2017) (B, C).
Figure 4.
Figure 4.
Neuronal and behavioral correlates of optical stimulation applied to specific neuronal populations. A, B, Neuronal and behavioral correlates of stimulating dopamine neurons. A, Inset, Blue visual cue predicted liquid reward along with laser stimulation, whereas the red visual cue predicted the delivery of reward alone. Peristimulus time histogram (PSTH; top) and raster plot (bottom) demonstrate that dopamine neurons responded more strongly to the cue that predicted reward with laser stimulation (blue) compared with cues that predicted reward alone (red). B, Probability of choosing the option associated with reward and optical stimulation. Animals chose between a cue that predicted reward with optical stimulation and a cue that predicted reward alone. Blue data (× and line) from one session with optical fiber in the injected hemisphere. Red data (× and line) from one session with optical fiber placed in the noninjected, control hemisphere. × indicates choices for the option associated with optical stimulation (top) or option associated with reward alone (bottom). Lines represent moving averages (sliding window with 10 steps) of the two choice sets. C, D, Neuronal and behavioral correlates of FEF to SC pathway stimulation. C, PSTH of SC neuronal responses to FEF axon terminal stimulation separated according to whether a saccade was evoked (filled, red histogram) or not evoked (black line). SC neurons responded more strongly after stimulation events that evoked a saccade compared with stimulations that did not evoke a saccade. D, Polar plot of the magnitude (r) and direction (θ) of optogenetically evoked saccades. Red lines indicate the averaged vector of evoked saccades at each stimulation site (n = 15). Saccade toward center of response field is represented by r = 1.0, θ = 0. Reproduced with permission from Stauffer et al. (2016) (A, B) and Inoue et al. (2015) (C, D).

References

    1. Abaya TV, Blair S, Tathireddy P, Rieth L, Solzbacher F (2012) A 3D glass optrode array for optical neural stimulation. Biomed Opt Express 3:3087–3104. 10.1364/BOE.3.003087 - DOI - PMC - PubMed
    1. Acker L, Pino EN, Boyden ES, Desimone R (2016) FEF inactivation with improved optogenetic methods. Proc Natl Acad Sci U S A 113:E7297–E7306. 10.1073/pnas.1610784113 - DOI - PMC - PubMed
    1. Acker LC, Pino EN, Boyden ES, Desimone R (2017) Large volume illumination for optogenetics in non-human primates. J Vis Exp 128:e56330 10.3791/56330 - DOI - PMC - PubMed
    1. Afraz A, Boyden ES, DiCarlo JJ (2015) Optogenetic and pharmacological suppression of spatial clusters of face neurons reveal their causal role in face gender discrimination. Proc Natl Acad Sci U S A 112:6730–6735. 10.1073/pnas.1423328112 - DOI - PMC - PubMed
    1. Bankiewicz KS, Eberling JL, Kohutnicka M, Jagust W, Pivirotto P, Bringas J, Cunningham J, Budinger TF, Harvey-White J (2000) Convection-enhanced delivery of AAV vector in parkinsonian monkeys; in vivo detection of gene expression and restoration of dopaminergic function using pro-drug approach. Exp Neurol 164:2–14. 10.1006/exnr.2000.7408 - DOI - PubMed

Publication types