. 2017 Nov 8;8(1):1372.
doi: 10.1038/s41467-017-01454-y.

Rapid termination of the African Humid Period triggered by northern high-latitude cooling

Affiliations

Rapid termination of the African Humid Period triggered by northern high-latitude cooling

James A Collins et al. Nat Commun. .

Abstract

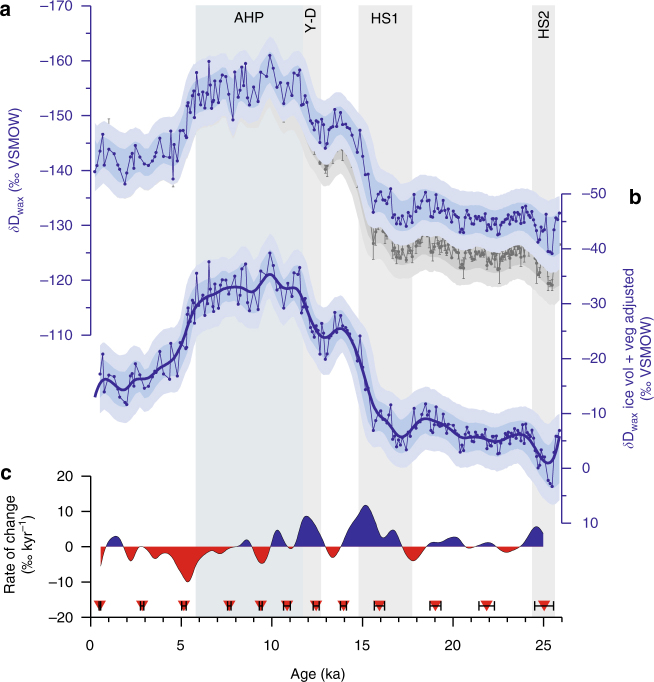
The rapidity and synchrony of the African Humid Period (AHP) termination at around 5.5 ka are debated, and it is unclear what caused a rapid hydroclimate response. Here we analysed the hydrogen isotopic composition of sedimentary leaf-waxes (δDwax) from the Gulf of Guinea, a proxy for regional precipitation in Cameroon and the central Sahel-Sahara. Our record indicates high precipitation during the AHP followed by a rapid decrease at 5.8-4.8 ka. The similarity with a δDwax record from northern East Africa suggests a large-scale atmospheric mechanism. We show that northern high- and mid-latitude cooling weakened the Tropical Easterly Jet and, through feedbacks, strengthened the African Easterly Jet. The associated decrease in precipitation triggered the AHP termination and combined with biogeophysical feedbacks to result in aridification. Our findings suggest that extratropical temperature changes, albeit smaller than during the glacial and deglacial, were important in triggering rapid African aridification during the Holocene.


Conflict of interest statement

The authors declare no competing financial interests.

Figures

Fig. 1
Fig. 1
Maps of the study area and climatology. a Colours represent mean monthly precipitation (mm) for the months Jun to Oct, the primary wet seasons for southern Cameroon and the Sahel. Red star marks the study site GeoB4905-4 (2°30.0´ N, 09°23.4´ E) in the Gulf of Guinea. Red dot marks the Gulf of Aden P178-15P core site, white dots mark other sites discussed in the text and blue dots mark SST records from Supplementary Table 1. Black arrows mark position of TEJ and AEJ in summer. Black box marks the inset. b Zoomed-in map of the study region showing C3–C4 vegetation distribution, rivers and bathymetry. Yellow dots mark the Douala, N’djamena, Niamey and Bangui GNIP stations, and Lake Ossa. Bathymetry shallower than 120 m is coloured in grey. c Monthly precipitation amount and δDp data for N’djamena, Chad and Doula, Cameroon, highlighting the large seasonal δDp changes in the Sahel compared to equatorial regions. Error bars represent standard deviation (1σ) of monthly measurements
Fig. 2
Fig. 2
Moisture sources for southern Cameroon and northern East Africa. ad FLEXPART, backward analyses of air mass trajectory for the period 1980–2015 at 0.25° resolution. The boxed region in southern Cameroon (9° E-14° E and 1° N-6° N) represents the estimated leaf-wax source region for Gulf of Guinea core GeoB4905-4. Colours represent the sources of moisture for the boxed region and show where E-P > 0 (mm day−1). eh Forward runs of FLEXPART for the southeast Atlantic moisture source (outlined with a red dashed line). Colours show precipitation derived from this moisture source (mm day−1). Numbers indicate total seasonal precipitation amount (mm) from this moisture-source delivered to the boxed regions in southern Cameroon and northern East Africa. The boxed region in northern East Africa represents the leaf-wax source region for the Gulf of Aden core P178-15P, estimated as 40° E-46° E and 7° N-14° N. il As eh but for the Sahel-Sahara moisture source (9° E–50° E and 6° N–20° N; marked with a red dashed rectangle). a, e, i represent Dec–Jan–Feb (DJF), b, f, j represent Mar–Apr–May (MAM), c, g, k represent Jun–Jul–Aug (JJA) and d, h, l represent Sep–Oct–Nov (SON)
Fig. 3
Fig. 3
δDwax from core GeoB4905-4 in the Gulf of Guinea. a Grey timeseries represents unadjusted δDwax. Error bars are individual analytical uncertainty. Shadings indicate 68 and 95% uncertainty bounds, including a mean analytical uncertainty of 3‰ and age uncertainty. Blue timeseries represents δDwax adjusted for ice volume, shading as above. b δDwax adjusted for ice-volume and vegetation-type changes, representing an estimate of past δDp. Shadings as above. Thick black line is the Ruppert-Sheather-Wand smooth, the optimal smoothing for the data set. c Rate of change (‰ kyr−1) based on Ruppert-Sheather-Wand smooth. Blue colours representing periods of wettening, red represent periods of aridification. Red diamonds mark calibrated radiocarbon age control points. Vertical bars highlight the African Humid Period (AHP), Younger-Dryas (Y-D) and Heinrich Stadials 1 and 2 (HS1, HS2)
Fig. 4
Fig. 4
SiZer map for GeoB4905-4 δDwax. The y-axis represents the range of bandwidths (h) for which the data were smoothed (plotted on a log scale) and the x-axis represents age. Blue regions represent significant decreases in δDwax (wettening), red regions significant increases in δDwax (drying), purple regions no significant change, and grey areas indicate where the sampling resolution is too low. The black horizontal line represents the data-driven Ruppert-Sheather-Wand bandwidth, the optimal smoothing (global bandwidth) for the entire data set. Time intervals where this line intersects with areas of significant increase or decrease are highlighted with vertical lines. δDwax is adjusted for ice volume and vegetation type
Fig. 5
Fig. 5
Comparison with other African δDwax records. a Mean JJA insolation at 10° N. b Gulf of Guinea δDwax from core GeoB4905-4 (based on the C29 n-alkane; ice-volume and vegetation adjusted; this study). c Gulf of Aden δDwax (based on the C30 fatty acid; ice-volume adjusted) from core P178-15P. d Lake Victoria δDwax (based on the C28 fatty acid; ice volume adjusted). e Lake Tana δDwax (based on the C28 fatty acid; ice volume adjusted). f Lake Tanganyika δDwax (based on the C28 fatty acid; ice volume and vegetation adjusted). g Lake Bosumtwi δDwax (based on the C31 n-alkane; ice volume and vegetation adjusted)[10]. Shadings indicate 68 and 95% uncertainty bounds, including analytical and age uncertainty. Thick lines represent Ruppert-Sheather-Wand smooth: rate of change (‰ kyr−1) in b and c is based on this smooth
Fig. 6
Fig. 6
Comparison with mid- and high-latitude records. a Principle Component 1 (PC1) scores from eight alkenone SST records in the northern Atlantic (Supplementary Table 1). PC1 represents 57.8% of the variance. b δ13C of benthic foraminfera from core EN120-GGC1 in the north Atlantic, interpreted as a record of NADW formation and ocean circulation: lower values represent slower ocean circulation. c Alkenone SST from core GeoB5901-2 in the Gulf of Cadiz, just to the north of Africa. d δDwax from GeoB4905-4 (ice-volume and vegetation adjusted, this study). Shadings indicate 68 and 95% uncertainty bounds, including analytical and age uncertainty
Fig. 7
Fig. 7
CCSM3 model output showing the effect of north Atlantic cooling on northern African winds and precipitation during the AHP. Height-latitude plots along longitudes 10° E (a, c, e, g) and 40° E (b, d, f, h) during JJA season. a, b Tropospheric temperature anomalies (°C) for the EHfre–EH experiment, highlighting the cool anomaly over the northern Sahara. c, d Zonal wind speed (m s−1), with contours representing the early Holocene control run (EH; negative values represent easterly winds). Shading represents anomalies (EHfre—EH): red region around 150 hPa is a negative easterly anomaly, blue region a positive easterly anomaly. e, f Vertical flow (Pa s−1), with contours representing the EH control run (negative values represent upward motion). Shading represents anomalies (EHfre—EH): red shows decreased upward motion, blue increased upward motion. g Precipitation anomalies (EHfre–EH; mm day−1) along 10° E. h Precipitation anomalies (EHfre–EH; mm day−1) along 40° E

References

    1. Gasse F. Hydrological changes in the African tropics since the Last Glacial Maximum. Quat. Sci. Rev. 2000;19:189–211. doi: 10.1016/S0277-3791(99)00061-X. - DOI
    1. Otto-Bliesner BL, et al. Coherent changes of southeastern equatorial and northern African rainfall during the last deglaciation. Science. 2014;346:1223–1227. doi: 10.1126/science.1259531. - DOI - PubMed
    1. deMenocal P, et al. Abrupt onset and termination of the African Humid Period: rapid climate responses to gradual insolation forcing. Quat. Sci. Rev. 2000;19:347–361. doi: 10.1016/S0277-3791(99)00081-5. - DOI
    1. Tierney JE, deMenocal P. Abrupt shifts in Horn of Africa hydroclimate since the Last Glacial Maximum. Science. 2013;342:843–846. doi: 10.1126/science.1240411. - DOI - PubMed
    1. Niedermeyer EM, et al. Extratropical forcing of Sahel aridity during Heinrich stadials. Geophys. Res. Lett. 2009;36:L20707. doi: 10.1029/2009GL039687. - DOI

Publication types

LinkOut - more resources