. 2017 Oct 25:8:762.
doi: 10.3389/fphar.2017.00762. eCollection 2017.

Corticotropin Releasing Factor in the Bed Nucleus of the Stria Terminalis in Socially Defeated and Non-stressed Mice with a History of Chronic Alcohol Intake

Affiliations

Corticotropin Releasing Factor in the Bed Nucleus of the Stria Terminalis in Socially Defeated and Non-stressed Mice with a History of Chronic Alcohol Intake

Lucas Albrechet-Souza et al. Front Pharmacol. .

Abstract

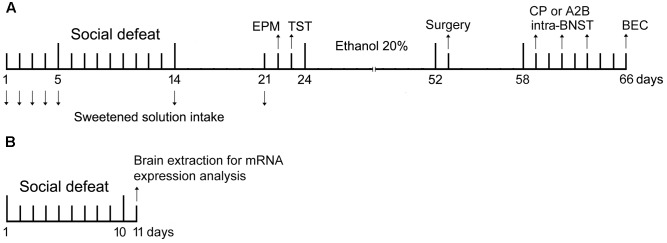
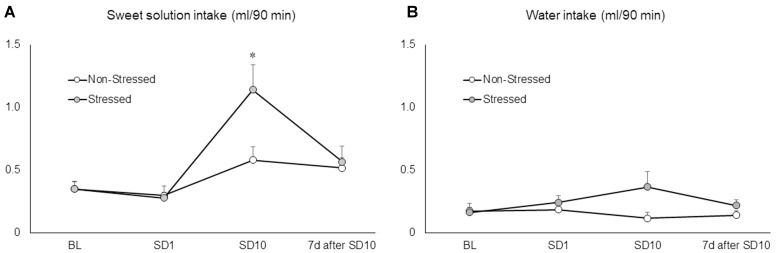
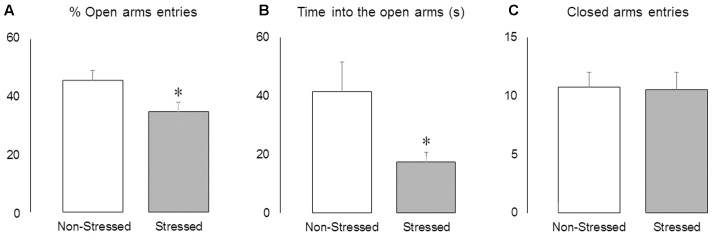
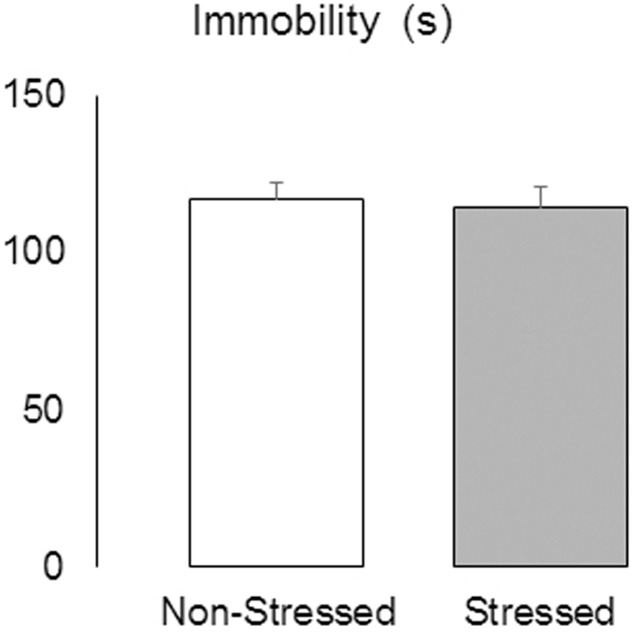
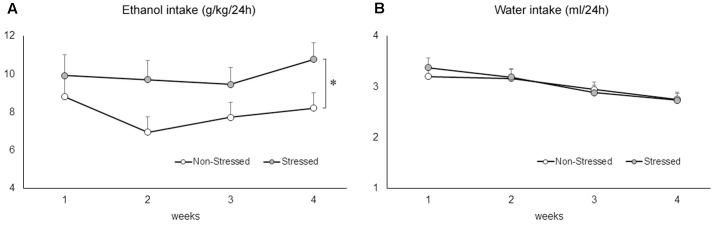
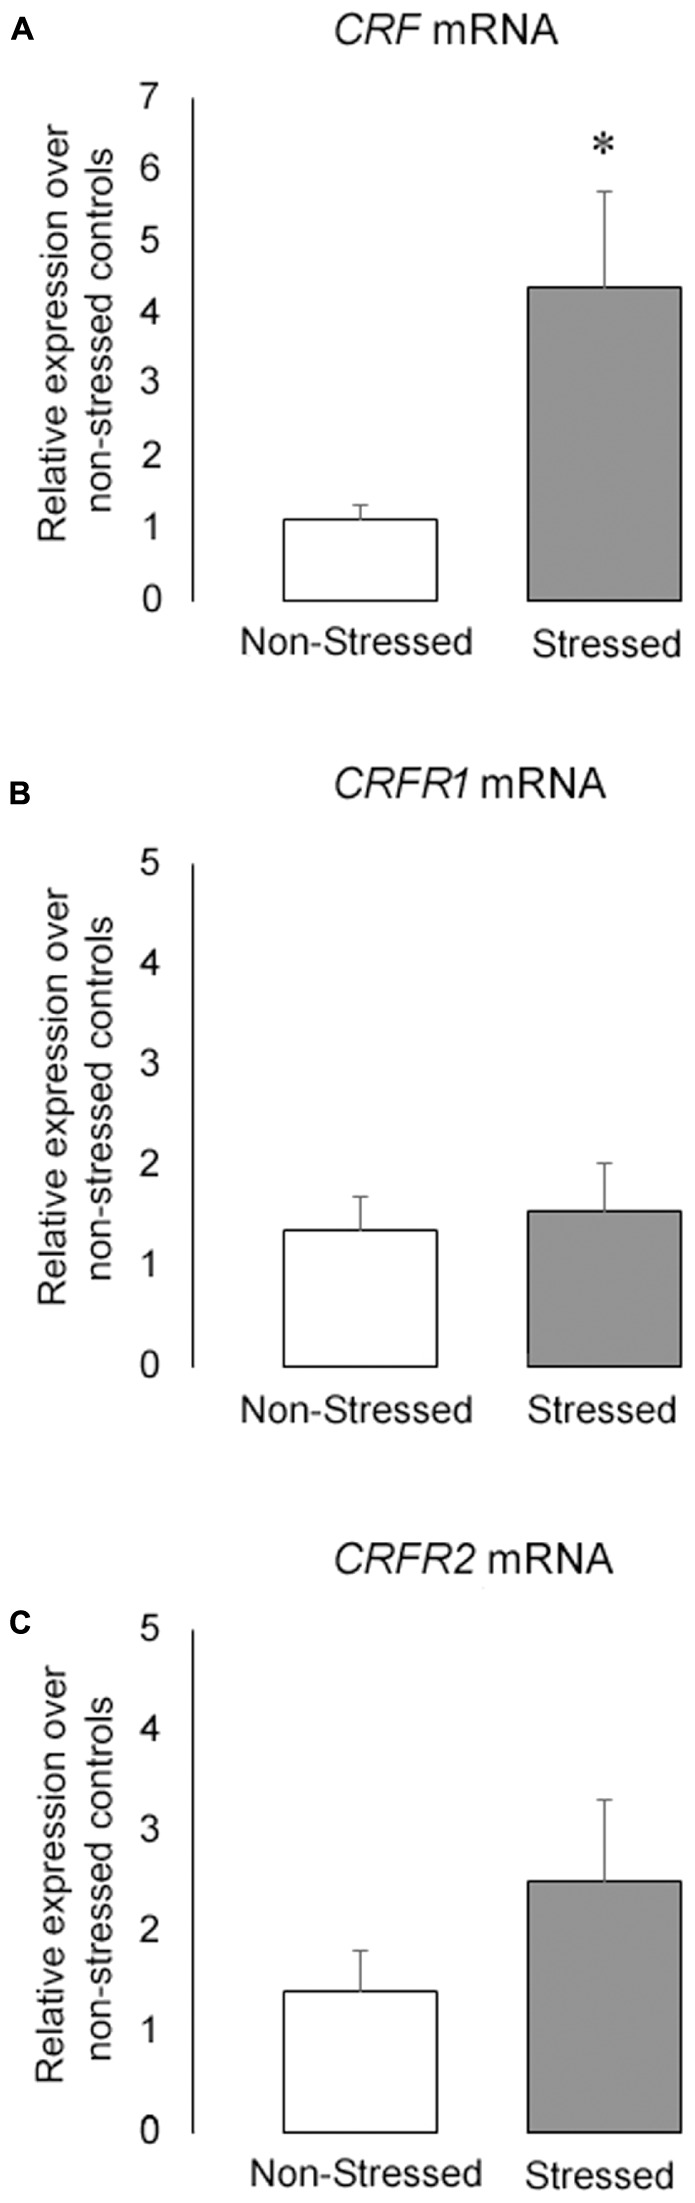
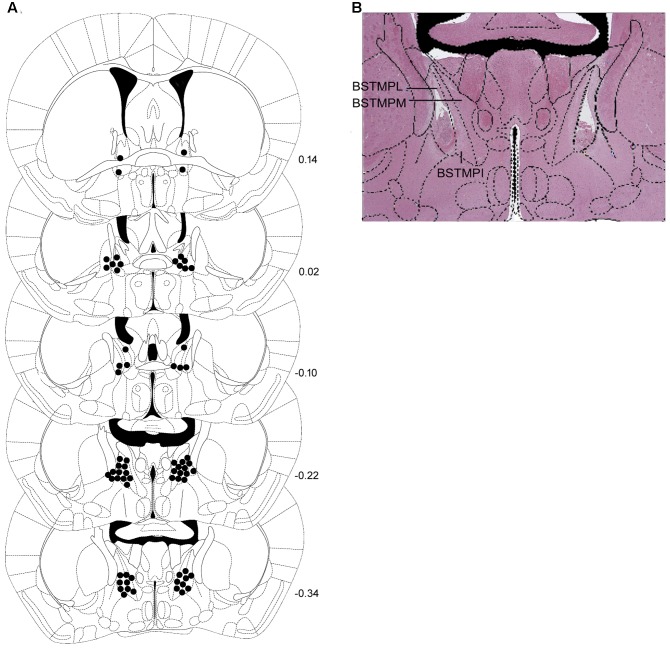
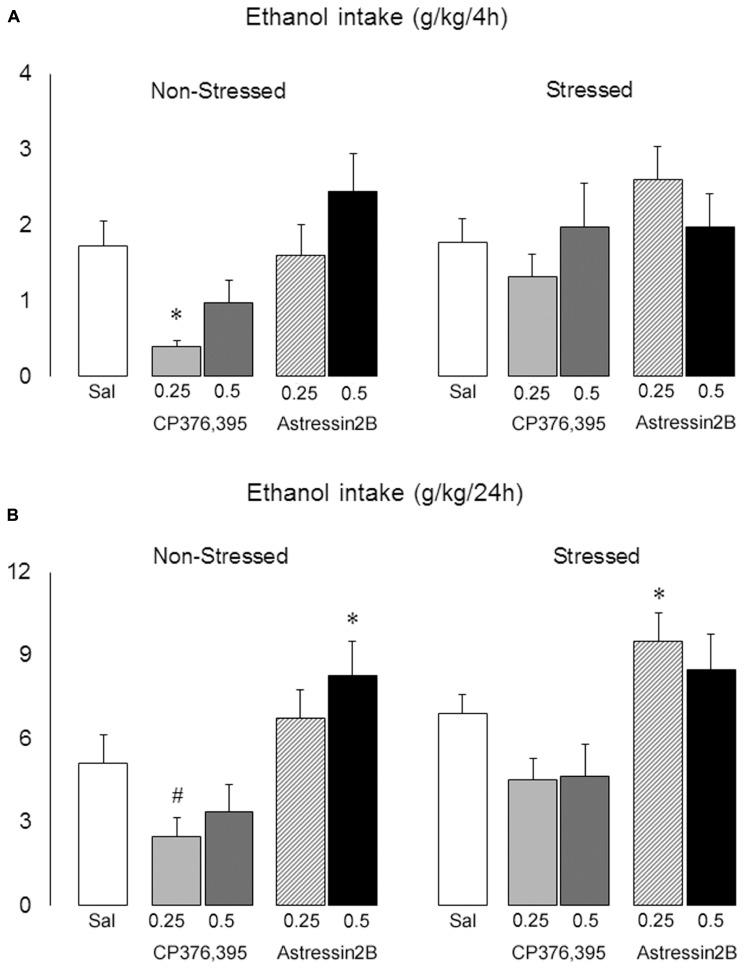
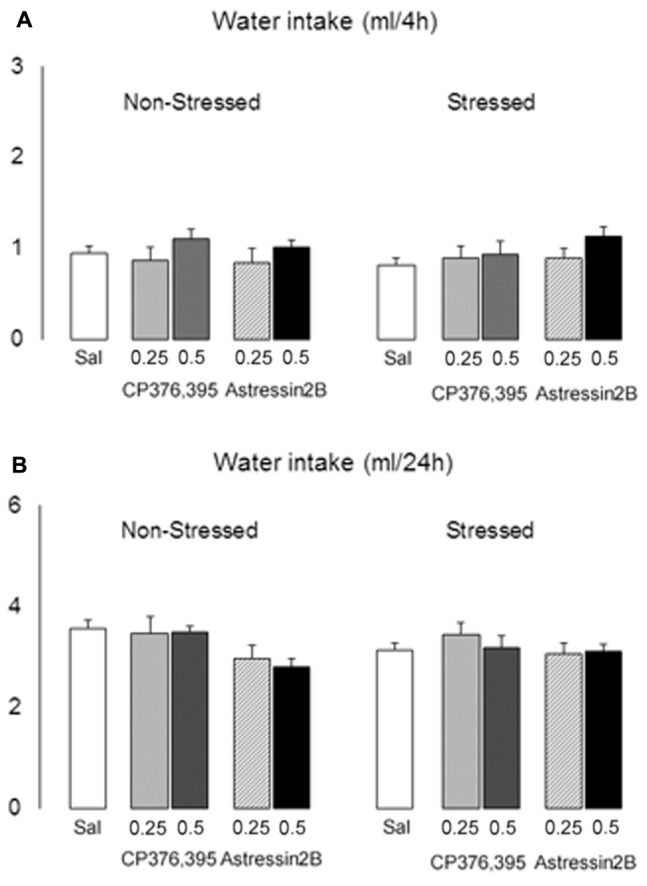
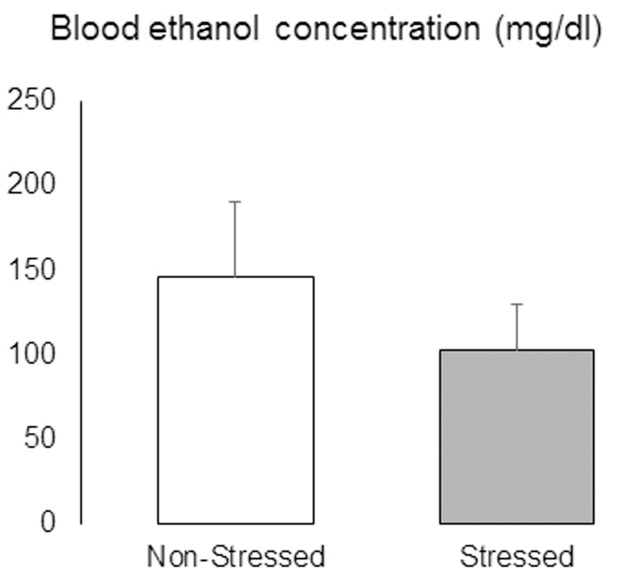
Stress exposure has been identified as one risk factor for alcohol abuse that may facilitate the transition from social or regulated use to the development of alcohol dependence. Preclinical studies have shown that dysregulation of the corticotropin releasing factor (CRF) neurotransmission has been implicated in stress-related psychopathologies such as depression and anxiety, and may affect alcohol consumption. The bed nucleus of the stria terminalis (BNST) contains CRF-producing neurons which seem to be sensitive to stress. In this study, adult male C57BL/6 mice previously defeated in resident-intruder confrontations were evaluated in the elevated plus-maze and tail suspension test. Mice were also tested for sweet solution intake before and after social stress. After having had continuous access to ethanol (20% weight/volume) for 4 weeks, control and stressed mice had CRF type 1 (CRFR1) or type 2 (CRFR2) receptor antagonists infused into the BNST and then had access to ethanol for 24 h. In separate cohorts of control and stressed mice, we assessed mRNA levels of BNST CRF, CRFR1 and CRFR2. Stressed mice increased their intake of sweet solution after ten sessions of social defeat and showed reduced activity in the open arms of the elevated plus-maze. When tested for ethanol consumption, stressed mice persistently drank significantly more than controls during the 4 weeks of access. Also, social stress induced higher BNST CRF mRNA levels. The selective blockade of BNST CRFR1 with CP376,395 effectively reduced alcohol drinking in non-stressed mice, whereas the selective CRFR2 antagonist astressin2B produced a dose-dependent increase in ethanol consumption in both non-stressed controls and stressed mice. The 10-day episodic defeat stress used here elicited anxiety- but not depressive-like behaviors, and promoted an increase in ethanol drinking. CRF-CRFR1 signaling in the BNST seems to underlie ethanol intake in non-stressed mice, whereas CRFR2 modulates alcohol consumption in both socially defeated and non-stressed mice with a history of chronic intake.

Keywords: BNST; CRF; CRF receptors; alcohol; anxiety; elevated plus-maze; extended amygdala; tail suspension test.


Figures

FIGURE 1
FIGURE 1
Experiment design. (A) Timeline refers to behavioral analysis and blood ethanol concentration (BEC) in non-stressed controls and socially defeated mice. On day 1, mice were exposed to sweet solution two-bottle choice for 24 h (habituation). On days 2–4 (baseline intake), 5, 14, and 21 mice were offered sweet solution in the two-bottle choice procedure for 90 min. On days 5–14, stressed mice were weighed and socially defeated. Controls were weighed daily. On day 22, controls and socially defeated mice were tested in the elevated plus-maze (EPM), and next day in the tail suspension test (TST). On day 24, mice were given continuous access to ethanol and water for 4 weeks before the surgical procedure to implant cannulae into the bed nucleus of the stria terminalis (BNST). After recovery, mice were infused with selective CRF receptors antagonists (CP376,395 or astressin2B) and tested for alcohol drinking. Each mouse received three microinjections, with a 48-h interval between them, in a design that counterbalanced saline and drug treatments. On day 66, mice were euthanized and had the brains and blood samples collected for histological and BEC analysis. (B) Timeline refers to analysis of CRF, CRFR1 and CRFR2 mRNA expression in the BNST in non-stressed controls and socially defeated mice. On days 1–10, controls were weighed daily and stressed mice were weighed and socially defeated. On day 11, mice were euthanized and had the brains collected for mRNA expression analysis.
FIGURE 2
FIGURE 2
Body weight (g) of non-stressed controls and socially defeated mice. Control non-stressed mice were weighed daily, while stressed mice were weighed and then socially defeated for ten consecutive sessions. Data are mean ± SEM. n = 36-37 mice per group.
FIGURE 3
FIGURE 3
(A) Sweet solution (ml/90 min) and (B) water intake (ml/90 min) measured in non-stressed controls and socially defeated mice before the beginning of the social defeat stress (baseline conditions, BL), after the first (SD1) and last social defeat session (SD10), and again 7 days after the last confrontation (7 days after SD10). BL corresponds to the average of three 90-min drinking sessions. Data are mean ± SEM. versus non-stressed controls and BL. p < 0.05, n = 12 mice per group.
FIGURE 4
FIGURE 4
Activity in the elevated plus-maze. (A) Percentage of open arms entries, (B) time spent into the open arms (s) and (C) frequency of closed arms entries in non-stressed controls and socially defeated mice 8 days after the last confrontation. Data are mean ± SEM. versus non-stressed controls. p < 0.05, n = 12 mice per group.
FIGURE 5
FIGURE 5
Immobility (s) measured in the tail suspension test in non-stressed controls and socially defeated mice 9 days after the last confrontation. Data are mean ± SEM. n = 11-12 mice per group.
FIGURE 6
FIGURE 6
(A) Ethanol (g/kg/24 h) and (B) water (ml/24 h) consumption in non-stressed controls and socially defeated mice 10 days after the last confrontation. Mice were exposed to continuous access to ethanol (20% weight/volume) and water for 4 weeks. Data are mean ± SEM. versus non-stressed controls. p < 0.05, n = 23-25 mice per group.
FIGURE 7
FIGURE 7
(A) CRF (B) CRFR1 and (C) CRFR2 mRNA levels in the BNST of non-stressed controls and socially defeated mice measured by qPCR. Gene expression was normalized to GAPDH using the ΔΔCt method and relative to control non-stressed group. Data are mean ± SEM. versus non-stressed controls. p < 0.05, n = 6 mice per group.
FIGURE 8
FIGURE 8
(A) Correct placements of intra-BNST bilateral cannulae in non-stressed controls and stressed mice and (B) representative photomicrograph after hematoxylin-eosin staining. Each diagram corresponds to a coronal section of the mouse brain according to the bregma (Paxinos and Franklin, 2001). The number of points in the figures is less than the total number of animals because of overlapping injection sites. BSTMPI, bed nucleus of the stria terminalis, medial division, posterointermediate part; BSTMPL, bed nucleus of the stria terminalis, medial division, posterolateral part; BSTMPM, bed nucleus of the stria terminalis, medial division, posteromedial part.
FIGURE 9
FIGURE 9
Effects of intra-BNST CRFR1 (CP376,395, CP) or CRFR2 (Astressin2B, A2B) antagonists on ethanol consumption in non-stressed controls and socially defeated mice exposed to continuous access to ethanol/water for 4 weeks. After infusions, mice were given continuous access to ethanol and water for 2 h, (A) 4 h and (B) 24 h. The graphs are split into non-stressed and stressed groups. Left bars represent non-stressed mice. Right bars represent socially defeated mice. Left, groups from left to right: Sal, non-stressed controls + saline, n = 20; 0.25, non-stressed controls + CP 0.25 μg/side, n = 11; 0.5, non-stressed controls + CP 0.5 μg/side, n = 11; 0.25, non-stressed controls + A2B 0.25 μg/side, n = 9; 0.5, non-stressed controls + A2B 0.5 μg/side, n = 9. Right, groups from left to right: Sal, stressed mice + saline, n = 24; 0.25, stressed mice + CP 0.25 μg/side, n = 12; 0.5, stressed mice + CP 0.5 μg/side, n = 11; 0.25, stressed mice + A2B 0.25 μg/side, n = 12; 0.5, stressed mice + A2B 0.5 μg/side, n = 12. Data are mean ± SEM. versus Sal group in the same condition (Non-stressed or Stressed, p < 0.05); #versus Non-stressed + Sal group (p = 0.06).
FIGURE 10
FIGURE 10
Effects of intra-BNST CRFR1 (CP376,395, CP) or CRFR2 (Astressin2B, A2B) antagonists on water consumption in non-stressed controls and socially defeated mice exposed to continuous access to ethanol/water for 4 weeks. After infusions, mice were given continuous access to ethanol and water for 2 h, (A) 4 h and (B) 24 h. The graphs are split into non-stressed and stressed groups. Left bars represent non-stressed mice. Right bars represent socially defeated mice. Left, groups from left to right: Sal, non-stressed controls + saline, n = 20; 0.25, non-stressed controls + CP 0.25 μg/side, n = 11; 0.5, non-stressed controls + CP 0.5 μg/side, n = 11; 0.25, non-stressed controls + A2B 0.25 μg/side, n = 9; 0.5, non-stressed controls + A2B 0.5 μg/side, n = 9. Right, groups from left to right: Sal, stressed mice + saline, n = 24; 0.25, stressed mice + CP 0.25 μg/side, n = 12; 0.5, stressed mice + CP 0.5 μg/side, n = 11; 0.25, stressed mice + A2B 0.25 μg/side, n = 12; 0.5, stressed mice + A2B 0.5 μg/side, n = 12. Data are mean ± SEM.
FIGURE 11
FIGURE 11
Blood ethanol concentrations (mg/dl) in non-stressed controls and socially defeated mice with a history of continuous access to ethanol. After the last test day, mice were given continuous access to ethanol and water for 48 h before being deeply anesthetized and had blood samples collected by cardiac puncture. Data are mean ± SEM. n = 11 mice per group.

References

    1. Albrechet-Souza L., Hwa L. S., Han X., Zhang E. Y., DeBold J. F., Miczek K. A. (2015). Corticotropin releasing factor binding protein and CRF2 receptors in the ventral tegmental area: modulation of ethanol binge drinking in C57BL/6J mice. Alcohol. Clin. Exp. Res. 39 1609–1618. 10.1111/acer.12825 - DOI - PMC - PubMed
    1. American Psychiatric Association (2013). Diagnostic and Statistical Manual of Mental Disorders, 5th Edn Arlington, VA: American Psychiatric Publishing; 10.1176/appi.books.9780890425596 - DOI
    1. Baldwin H. A., Rassnick S., Rivier J., Koob G. F., Britton K. T. (1991). CRF antagonist reverses the “anxiogenic” response to ethanol withdrawal in the rat. Psychopharmacology 103 227–232. 10.1007/BF02244208 - DOI - PubMed
    1. Bale T. L., Vale W. W. (2004). CRF and CRF receptors: role in stress responsivity and other behaviors. Annu. Rev. Pharmacol. Toxicol. 44 525–557. 10.1146/annurev.pharmtox.44.101802.121410 - DOI - PubMed
    1. Becker H. C., Lopez M. F., Doremus-Fitzwater T. L. (2011). Effects of stress on alcohol drinking: a review of animal studies. Psychopharmacology 218 131–156. 10.1007/s00213-011-2443-9 - DOI - PMC - PubMed

LinkOut - more resources