. 2017 Oct 25:8:1812.
doi: 10.3389/fpls.2017.01812. eCollection 2017.

Genome-Wide Identification and Expression, Protein-Protein Interaction and Evolutionary Analysis of the Seed Plant-Specific BIG GRAIN and BIG GRAIN LIKE Gene Family

Affiliations

Genome-Wide Identification and Expression, Protein-Protein Interaction and Evolutionary Analysis of the Seed Plant-Specific BIG GRAIN and BIG GRAIN LIKE Gene Family

Bhuwaneshwar S Mishra et al. Front Plant Sci. .

Abstract

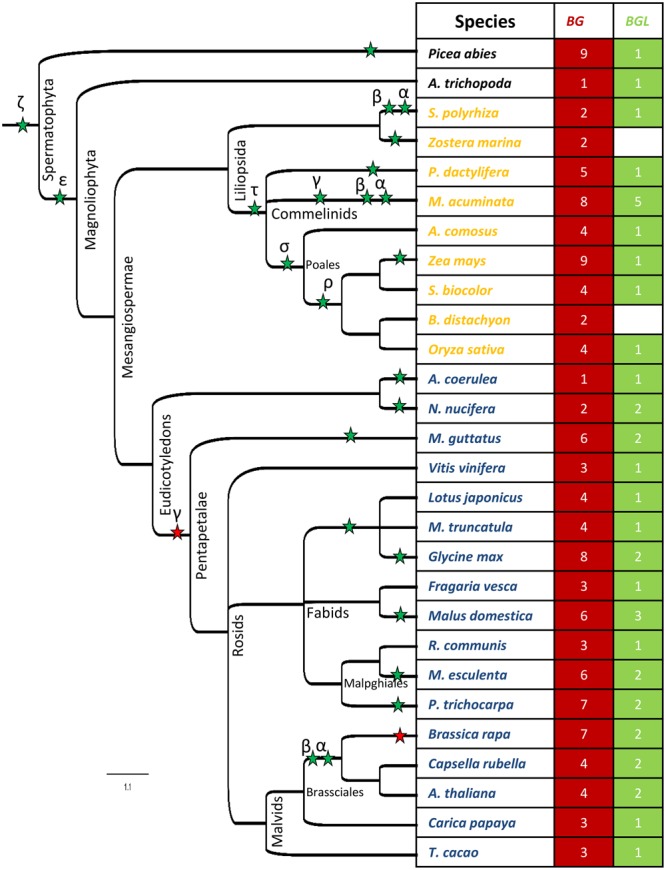
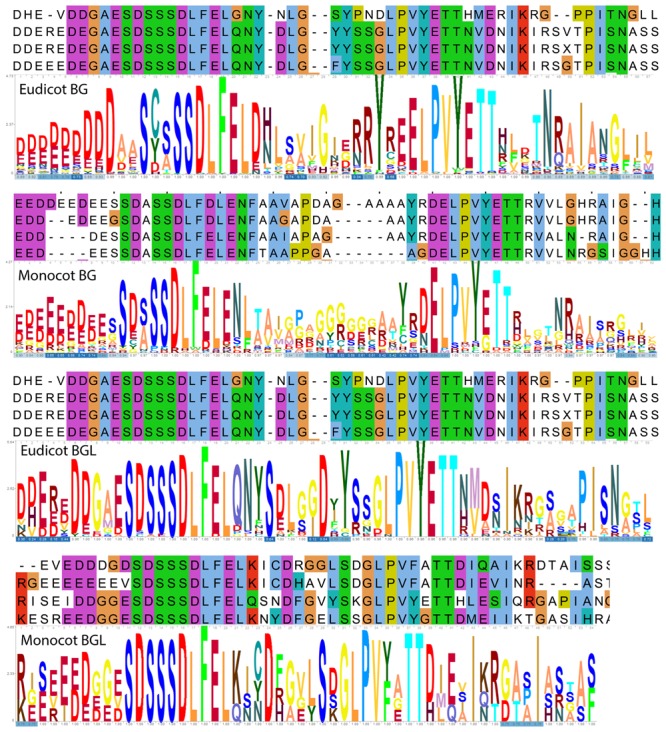
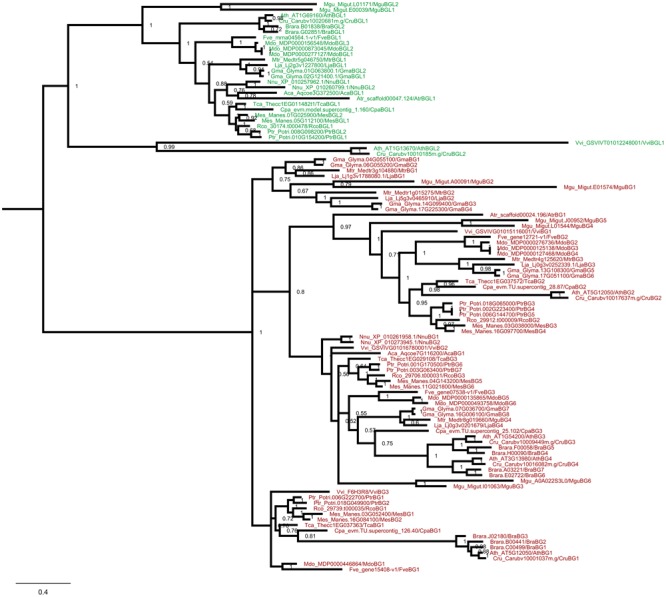
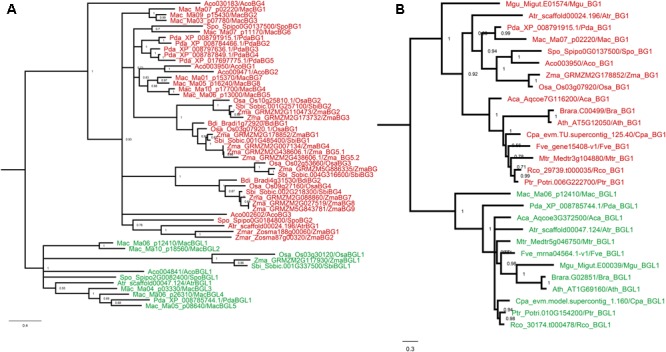
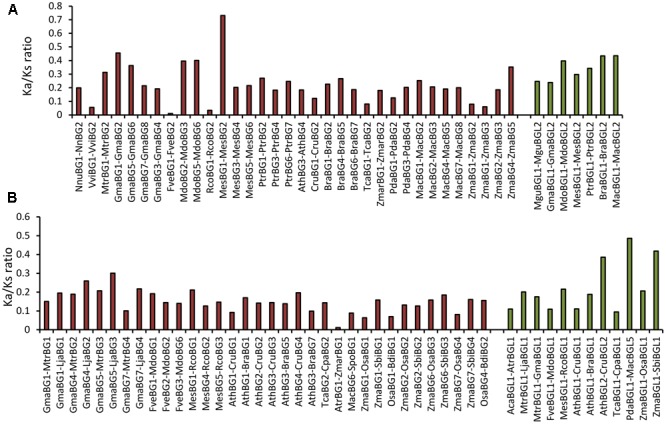
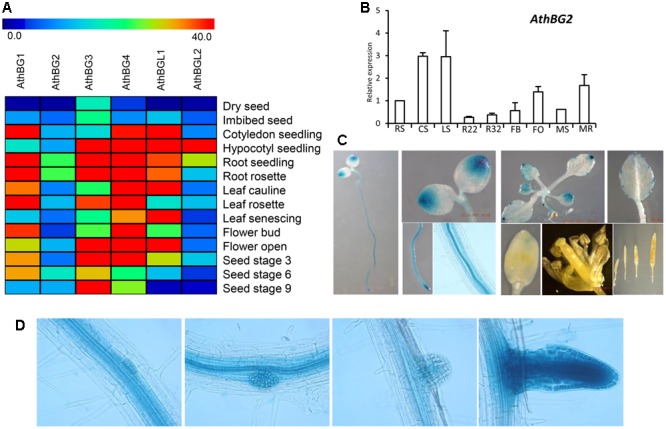
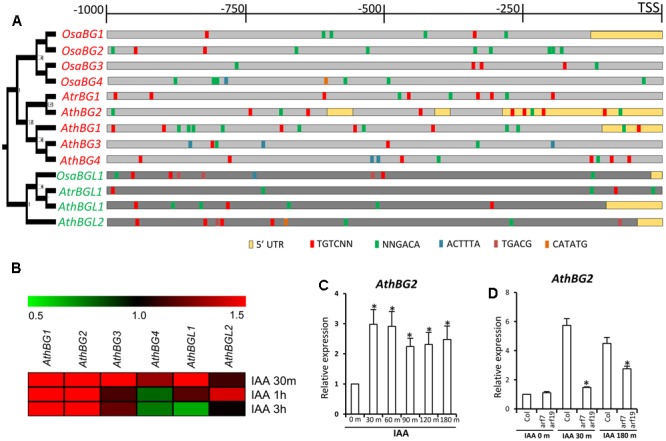
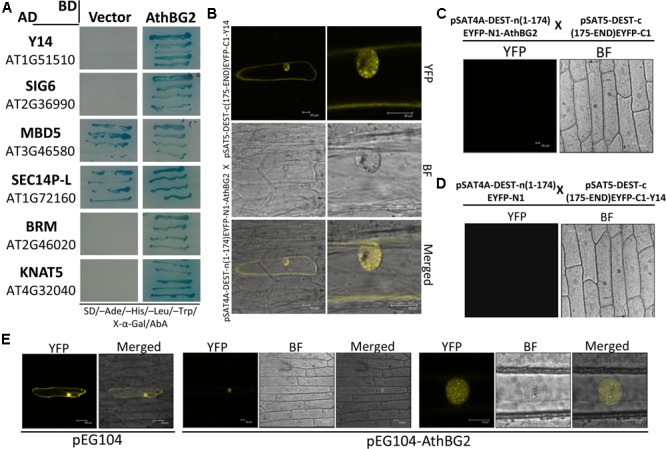
BIG GRAIN1 (BG1) is an auxin-regulated gene which functions in auxin pathway and positively regulates biomass, grain size and yield in rice. However, the evolutionary origin and divergence of these genes are still unknown. In this study, we found that BG genes are probably originated in seed plants. We also identified that seed plants evolved a class of BIG GRAIN LIKE (BGL) genes which share conserved middle and C-terminal motifs with BG. The BG genes were present in all monocot and eudicot species analyzed; however, the BGL genes were absent in few monocot lineages. Both BG and BGL were found to be serine-rich proteins; however, differences in expansion and rates of retention after whole genome duplication events were observed. Promoters of BG and BGL genes were found to be enriched with auxin-responsive elements and the Arabidopsis thaliana BG and BGL genes were found to be auxin-regulated. The auxin-induced expression of AthBG2 was found to be dependent on the conserved ARF17/19 module. Protein-protein interaction analysis identified that AthBG2 interact with regulators of splicing, transcription and chromatin remodeling. Taken together, this study provides interesting insights about BG and BGL genes and incentivizes future work in this gene family which has the potential to be used for crop manipulation.

Keywords: ARF7/19; BIG GRAIN; BIG GRAIN LIKE; Phylogenetic analysis; auxin; gene family.


Figures

FIGURE 1
FIGURE 1
The distribution of BG and BGL genes in different plant genomes. The numbers represent the distribution of BG and BGL genes in each species. The asterisks indicates the WGD events in the plant lineages. The green and red asterisks indicate genome duplication and triplication respectively.
FIGURE 2
FIGURE 2
The conserved C-terminal motif in BG and BGL protein family in eudicots and monocots. The sample alignment is given on the top and HMM logo of the motif is given in the bottom for each group.
FIGURE 3
FIGURE 3
Phylogenetic analysis of BG and BGL proteins from eudicots. Bayesian phylogenetic reconstruction of BG and BGL proteins from eudicots and A. trichopoda based on JTT + I + G model. The posteriori probability values are given adjacent to the branches. The BG and BGL proteins are marked by red and green color respectively.
FIGURE 4
FIGURE 4
Phylogenetic analysis of BG and BGL proteins from monocots and eudicots. (A) Bayesian phylogenetic reconstruction of BG and BGL proteins from monocots and A. trichopoda. (B) Bayesian phylogenetic reconstruction of selected BG and BGL proteins from angiosperms. The phylograms were reconstructed on the basis of JTT + I + G model and the posteriori probability values are given adjacent to the branches. The BG and BGL proteins are marked by red and green color respectively.
FIGURE 5
FIGURE 5
Analysis of selection pressure on BG and BGL genes. (A) The Ka/Ks ratio of paralogous BG and BGL genes from eudicots and monocots. (B) The Ka/Ks ratio of orthologous BG and BGL genes from eudicots and monocots.
FIGURE 6
FIGURE 6
Tissue and developmental stage-specific expression analysis of A. thaliana BG and BGL genes. (A) Heat map showing the expression of A. thaliana BG and BGL genes in different tissues and developmental stages (B) The qRT-PCR expression analysis of AthBG2 in different developmental stages and tissues. The expression in radicle stage was taken as control to compare the expression in other stages and tissues. UBQ10 was used as the endogenous control. The graph was plotted from the values of two biological replicates with three technical replicates each. The abbreviation of samples: RS, seeding radicle stage; CS, seeding cotyledon stage; seedling two-leaf stage; R22, rosette 22 days old; R32, rosette 32 days old; FB, flower bud; FO, flower open; MS, mature silique; MR, mature root. (C) Promoter activity of AthBG2 in different tissues and developmental stages of A. thaliana. (D) Promoter activity of AthBG2 during lateral root development.
FIGURE 7
FIGURE 7
Promoter analysis and auxin-responsive expression study of BG and BGL genes. (A) Auxin-responsive elements in the BG and BGL promoters A. trichopoda, A. thaliana and O. sativa along with the Bayesian phylogram of proteins. (B) Heat map showing the auxin-dependent expression of A. thaliana BG and BGL genes. (C) The qRT-PCR expression analysis of AthBG2 in response to IAA treatments. Asterisk indicates a significant difference in expression in treatment in comparison to untreated control (P < 0.05, Student’s t-test). (D) The qRT-PCR expression analysis of AthBG2 in response to IAA treatments in Col-0 and arf7arf19 double mutant. Asterisk indicates a significant difference in expression in the mutant in response to 30 or 180 min IAA treatment in comparison to the response in the WT (P < 0.05, Student’s t-test). The graphs of qRT-PCR experiments were plotted from the values of two biological replicates with three technical replicates each. UBQ10 was used as the endogenous control for both experiments.
FIGURE 8
FIGURE 8
Protein-protein interaction and localization analysis of AthBG2. (A) The interacting proteins of AthBG2 identified from the Arabidopsis Y2H library screening. (B–D) BiFC confirmation of AthBG2-Y14 interaction with negative control experiments. (E) Subcellular localization of AthBG2. For both BiFC and localization experiments, YFP was excited at 514 nm and fluorescence emission was recorded at 530 nm.

References

    1. Albert V. A., Barbazuk W. B., dePamphilis C. W., Der J. P., Leebens-Mack J., Ma H., et al. (2013). The Amborella genome and the evolution of flowering plants. Science 342 1241089–1241089. 10.1126/science.1241089 - DOI - PubMed
    1. Al-Mssallem I. S., Hu S., Zhang X., Lin Q., Liu W., Tan J., et al. (2013). Genome sequence of the date palm Phoenix dactylifera L. Nat. Commun. 4 520–524. 10.1038/ncomms3274 - DOI - PMC - PubMed
    1. Argout X., Salse J., Aury J.-M., Guiltinan M. J., Droc G., Gouzy J., et al. (2011). The genome of Theobroma cacao. Nat. Genet. 43 101–108. 10.1038/ng.736 - DOI - PubMed
    1. Bertioli D. J., Moretzsohn M. C., Madsen L. H., Sandal N., Leal-Bertioli S. C., Guimaraes P. M., et al. (2009). An analysis of synteny of Arachis with Lotus and Medicago sheds new light on the structure, genomes stability and evolution of legume. BMC Genomics 10:45. 10.1186/1471-2164-10-45 - DOI - PMC - PubMed
    1. Bowers J. E., Chapman B. A., Rong J., Paterson A. H. (2003). Unravelling angiosperm genome evolution by phylogenetic analysis of chromosomal duplication events. Nature 422 433–438. 10.1038/nature01521 - DOI - PubMed

LinkOut - more resources