. 2017:1:0056.
doi: 10.1038/s41551-017-0056. Epub 2017 Apr 10.

Next-generation in vivo optical imaging with short-wave infrared quantum dots

Affiliations

Next-generation in vivo optical imaging with short-wave infrared quantum dots

Oliver T Bruns et al. Nat Biomed Eng. 2017.

Abstract

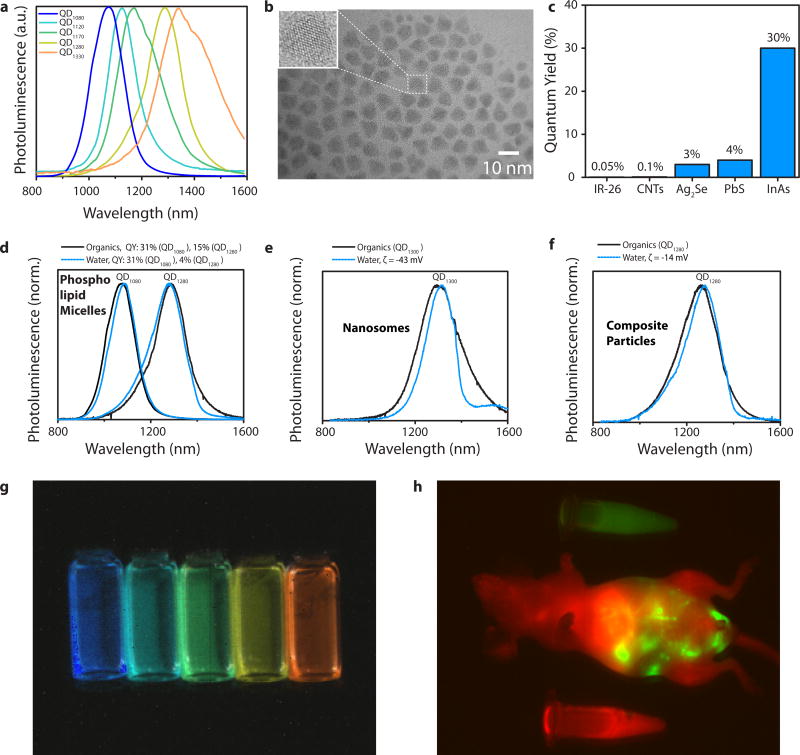
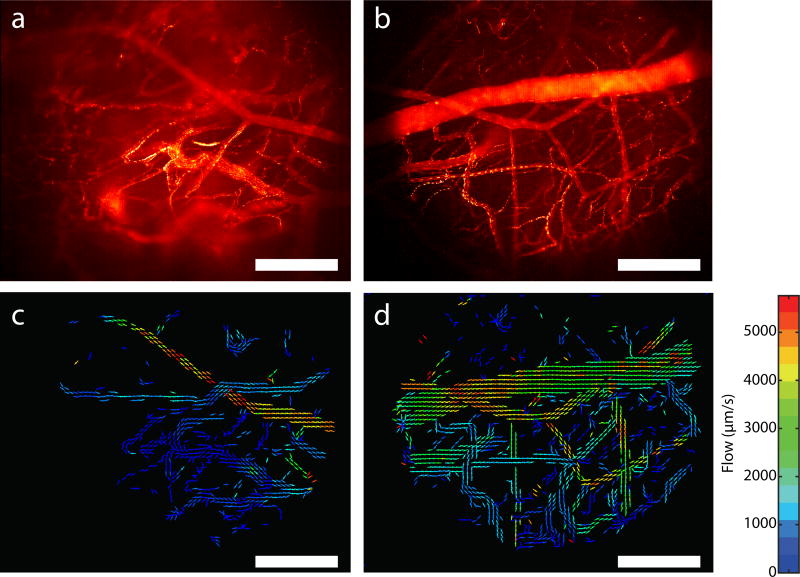
For in vivo imaging, the short-wavelength infrared region (SWIR; 1000-2000 nm) provides several advantages over the visible and near-infrared regions: general lack of autofluorescence, low light absorption by blood and tissue, and reduced scattering. However, the lack of versatile and functional SWIR emitters has prevented the general adoption of SWIR imaging by the biomedical research community. Here, we introduce a class of high-quality SWIR-emissive indium-arsenide-based quantum dots (QDs) that are readily modifiable for various functional imaging applications, and that exhibit narrow and size-tunable emission and a dramatically higher emission quantum yield than previously described SWIR probes. To demonstrate the unprecedented combination of deep penetration, high spatial resolution, multicolor imaging and fast-acquisition-speed afforded by the SWIR QDs, we quantified, in mice, the metabolic turnover rates of lipoproteins in several organs simultaneously and in real time as well as heartbeat and breathing rates in awake and unrestrained animals, and generated detailed three-dimensional quantitative flow maps of the mouse brain vasculature.


Conflict of interest statement

Competing Financial Interests The authors declare no competing financial interests

Figures

Figure 1
Figure 1. Short-wave infrared quantum dots for next generation in vivo optical imaging
A schematic overview of the synthesis of core/shell and core/shell/shell SWIR quantum dots and the subsequent functionalization for next generation imaging applications is shown. InAs QDs are synthesized via continuous injection approach which allows for improved nanocrystal growth over long time at high reaction temperatures. Subsequently InAs core QDs are overcoated with various shell materials to allow for a further red-shift and fine-tuning of the emission. The class of synthesized core-shell (CS) and core-shell-shell (CSS) QDs are then functionalized via three distinct surface coatings that tailor the physiological properties for specific SWIR imaging applications.
Figure 2
Figure 2. InAs core/shell quantum dots with high quantum yield and size-tunable emission for functional and high-speed SWIR imaging
Spectra of five different core/shell and core/shell/shell SWIR QDs are shown (QD1080: InAs(CdSe)1(ZnSe)3, QD1120: InAs(CdSe)1.5, QD1170 InAs(CdSe)3, QD1280: InAs(Cd0.9Zn0.1S), QD1330 InAs(CdSe)6) (a). A representative TEM of core/shell/shell SWIR QDs shows monodisperse nanoparticles with a diameter of 7 nm and a narrow size distribution of 8% (b). Core/shell and core/shell/shell SWIR QDs exhibit a quantum yield in aqueous buffer of up to 30%, much higher than for previously-used materials (c). The emission spectra remain unaffected after transfer into aqueous buffer from organic solvent for PEGylated SWIR QDs (ζ = −12 mV for QD1300) (d), nanosomes with SWIR QDs (e) and PEGylated SWIR QD composite particles (f). Note that water has a very strong absorption band around 1450 nm which can be recognized as a feature caused by reabsorption through the solvent in the three spectra. A spectral image of the five samples shown in (a) yields a pseudo-color SWIR image (g). Two different SWIR QDs were injected into a nude mouse intraperitoneally (green) and intravenously (red). A spectral image was taken and separated into red and green by linear unmixing (h).
Figure 3
Figure 3. QD nanosomes for metabolic imaging
(a) A solution of a SWIR QD labeled recombinant chylomicrons was injected at a constant rate (26.7 µL/min or 0.267 mg triglycerides/min) into the tail vein of a cold-exposed mouse. The mouse was illuminated using an 808 nm laser with 15 mW/cm2, and the SWIR emission was measured for the brown adipose tissue (BAT), liver and tail vein. (b) This process was repeated for four mice, with the darkened curves representing the results from the one mouse shown in (a), and the lighter curves showing the qualitative similarity of the other mice. The BAT signal after the injection revealed two distinct timescales for clearance: the initial signal loss is consistent with binding and release (about 3 minute time constant, 50% of the signal), while the longer-term component is consistent with uptake (>30 minute time constant).
Figure 4
Figure 4. High-speed SWIR imaging for contact free monitoring of heart and respiratory rate in anesthetized and awake mice using QD phospholipid micelles
Imaging in ventral orientation (a) at video-rate (30 fps; Supplementary Video 4) with SWIR QDs (808 nm excitation) allows imaging vital signs like heart rate (red ROI) and respiration (blue ROI). (b) The respiratory rate of this anesthetized mouse is 84 breaths per minute (c) and the heart rate is 130 beats per minute (d). The bright emission of our SWIR QDs allows the imaging of an awake mouse (66.5 fps; Supplementary Video 5) and the detection of the signal fluctuations generated by motion of liver and heart (e). A respiratory rate of 300 breaths per minute (f) and a heart rate of 550 beats per minute (g) is observed in this awake but resting mouse.
Figure 5
Figure 5. High-speed intravital imaging using QD composite particles
SWIR intravital imaging (808 nm excitation, 1000nm long pass for emission) in a mouse with a cranial window (a) bearing a glioblastoma multiforme (GBM) in the left hemisphere of the brain as shown in (b). Principal component analysis (PCA) was used to distinguish arterial (c) from venous vessels (d) in the brain. This information is color-coded creating a multicolor angiograph (e) showing the abnormalities of the tumor microvascular network as opposed to normal arterial/venous brain vasculature (green: tumor; red: arterial vessels; blue: venous vessels). Scale bars are 1500 µm.
Figure 6
Figure 6. High resolution high-speed intravital imaging using QD composite particles
In addition to generating a multicolor angiography image of a glioblastoma tumor in a cranial window model (a) high-resolution high-speed QD-SWIR imaging at 60 fps was used to image the vascular network of the tumor margin (b) and to compare it to the vasculature in the contralateral hemisphere (c). Maximum intensity projections of 600 frames over 10 seconds are shown here. By subtracting the average signal of these 600 frames from the maximum intensity projection the signal originating only from individual QD-SWIR composite particles in the focus was isolated. This allowed isolating blood flow from the focal plane of the tumor margin (d) and the vessels on the contralateral lateral side (e). To enhance the contrast of the focal plane and provide true z-sectioning capability, we calculated the sum of the magnitude of the difference of each frame from the average, which is sensitive only to fluctuations over time, i.e. the transit of individual composite particles. Figures 6f–k directly compare the micrographs of the same fields of view of a healthy mouse brain at various depths taken by our z-sectioning approach (f—i) and conventional multiphoton microscopy (i—k). Scale bars in b—e are 300 µm, and in f—k are 200 µm. Scale bar for (a) is 1500 µm, scale bars for (b—e) are 300 µm and scale bars for (f—k) are 200 µm.
Figure 7
Figure 7. High resolution high-speed SWIR intravital imaging to generate flow maps of microvascular networks using QD composite particles
Applying a multi-pass particle image velocimetry (PIV) approach in the tumor margin and the healthy hemisphere (as shown in Figure 6b,c) generates a flow map for each slice (c and d). All scale bars are 300 µm, and the units for velocity are µm/s.

References

    1. de Jong M, Essers J, van Weerden WM. Imaging preclinical tumour models: improving translational power. Nat. Rev. Cancer. 2014;14:481–493. - PubMed
    1. Welsher K, et al. A route to brightly fluorescent carbon nanotubes for near-infrared imaging in mice. Nat. Nanotechnol. 2009;4:773–80. - PMC - PubMed
    1. Yi H, et al. M13 phage-functionalized single-walled carbon nanotubes as nanoprobes for second near-infrared window fluorescence imaging of targeted tumors. Nano Lett. 2012;12:1176–83. - PMC - PubMed
    1. Hong G, et al. Through-skull fluorescence imaging of the brain in a new near-infrared window. Nat. Photonics. 2014;8:723–730. - PMC - PubMed
    1. Ghosh D, et al. Deep, noninvasive imaging and surgical guidance of submillimeter tumors using targeted M13-stabilized single-walled carbon nanotubes. Proc. Natl. Acad. Sci. U. S. A. 2014;111:13948–53. - PMC - PubMed

LinkOut - more resources