

Quantitative differentiation of whole smoke solution-induced mutagenicity in the mouse lymphoma assay
- PMID: 29119619
- PMCID: PMC8142256
- DOI: 10.1002/em.22151
Quantitative differentiation of whole smoke solution-induced mutagenicity in the mouse lymphoma assay
Abstract
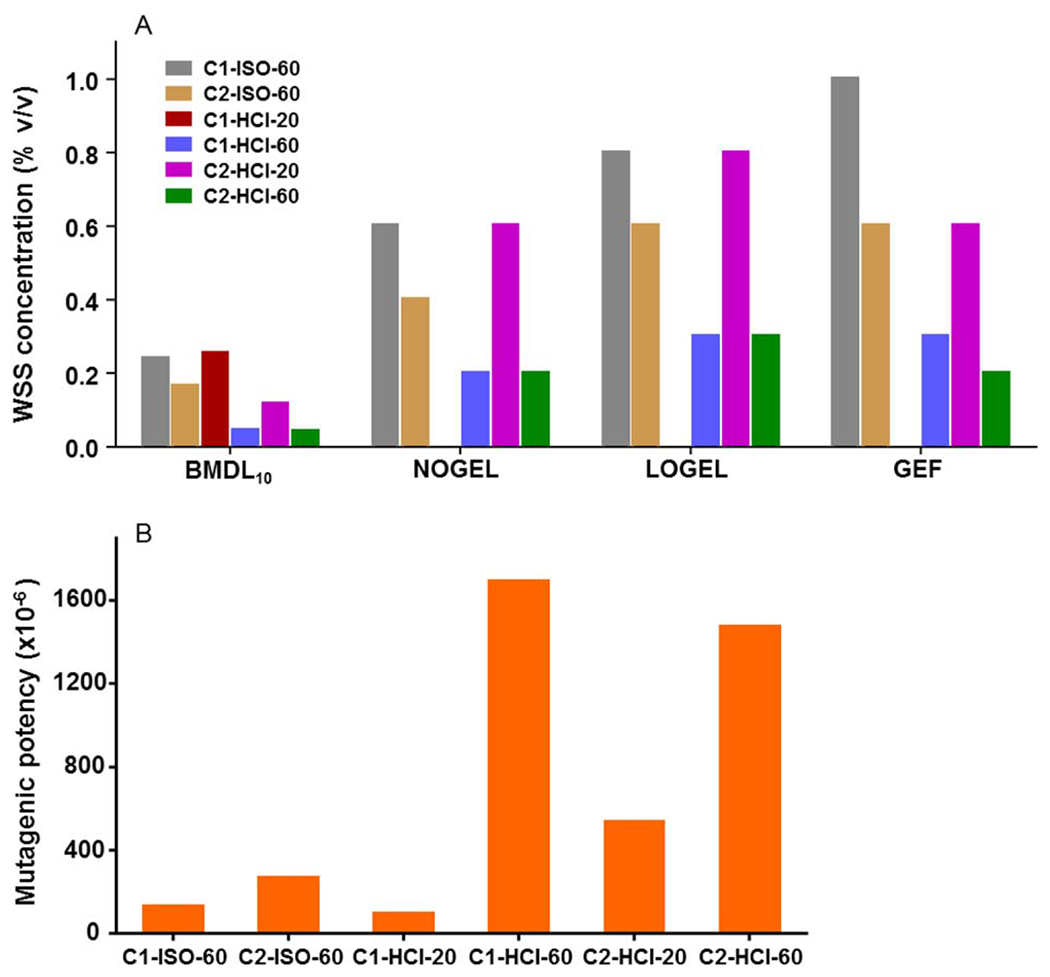
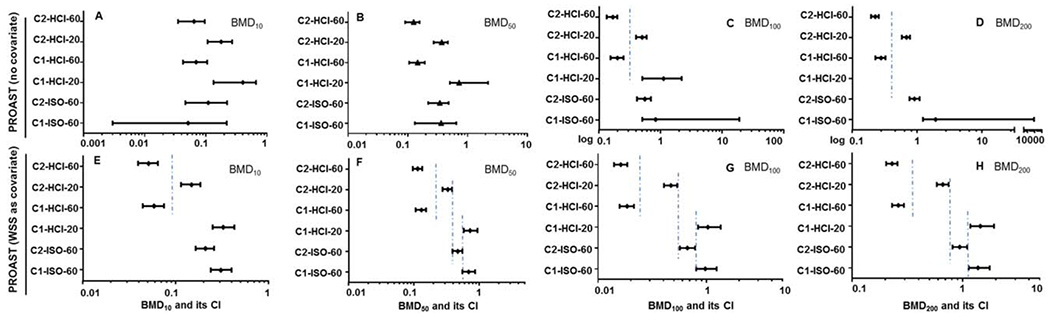
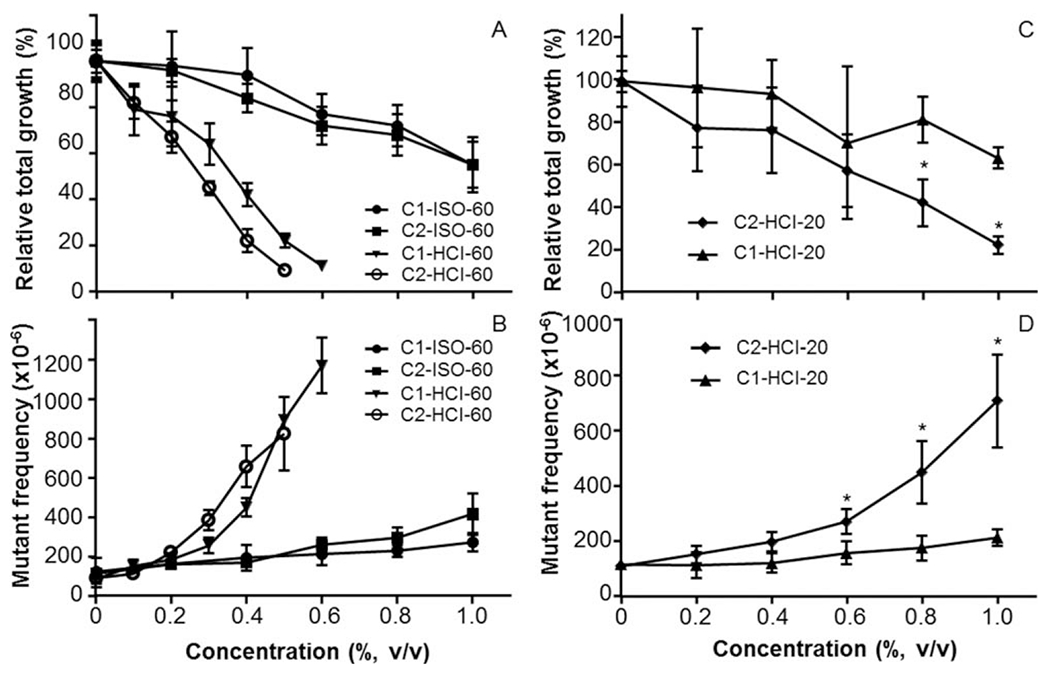
In vitro genotoxicity dose-response data have been investigated for their utility in modeling and assessing potential differences in mutagenic responses between machine-generated whole smoke solutions (WSSs) from combusted cigarette tobacco products. Our previous study observed that potency ranking by benchmark dose (BMD) analysis was a useful modeling approach for quantitative assessment of differences between the mutagenicity of several structurally diverse chemical constituents of cigarette smoke. To follow-up on these observations, we used the mouse lymphoma assay (MLA) to evaluate the mutagenicity of WSSs prepared from two commercial cigarettes smoked under two different smoking machine regimens. L5178Y cells were exposed to ≥5 concentrations of each WSS for 4 hr ± S9 activation. S9 reduced the cytotoxicity and enhanced the mutagenicity of the WSSs. The resulting S9-mediated mutagenicity dose-responses were compared between test articles using BMD analysis, the lowest dose exceeding the Global Evaluation Factor, the no observed or lowest observed genotoxic effect level, and the mutagenic potency. The BMD10 , BMD50 , BMD100 , and BMD200 , indicating a 10%, 50%, 100%, or 200% increase in the background mutant frequency, respectively, were calculated using the PROAST software package. Overall, the quantitative approaches resulted in a similar rank order of mutagenic potency for the MLA tested WSSs, with potency increasing with the level of tar. The BMD approach using covariate analysis produced the most informative comparisons. Differences in potency were associated with the number of cigarettes smoked, the cigarette product smoked, and the smoking machine protocol used to prepare the sample. Under the conditions of this study, these results suggest that our hypothesis of modeling MLA data using the BMD approach to quantitatively discriminate between the mutagenic potential of WSSs from combustible cigarettes might be an useful method. Environ. Mol. Mutagen. 59:103-113, 2018. Published 2017. This article is a US Government work and is in the public domain in the USA.
Keywords: benchmark dose; mouse lymphoma assay; quantitative analysis; whole smoke solution.
© 2017. This article is a US Government work and is in the public domain in the USA.
Figures
References
-
- Cao X, Mittelstaedt RA, Pearce MG, Allen BC, Soeteman-Hernandez LG, Johnson GE, Bigger CA, Heflich RH. 2014. Quantitative dose–response analysis of ethyl methanesulfonate genotoxicity in adult gpt-delta transgenic mice. Environ Mol Mutagen 55:385–399. - PubMed
-
- CDC. 2014. Mechanisms of cancer induction by tobacco smoke. 2014 Surgeon General’s Report: The health consequences of smoking—50 years of progress. http://www.surgeongeneral.gov/library/reports/50-years-of-progress/full-... (accessed 10/2/2017).
-
- CDC. 2016. Tobacco. National Biomonitoring Program. https://www.cdc.gov/biomonitoring/tobacco.html (accessed 10/2/2017).
-
- DeMarini DM, Gudi R, Szkudlinska A, Rao M, Recio L, Kehl M, Kirby PE, Polzin G, Richter PA. 2008. Genotoxicity of 10 cigarette smoke condensates in four test systems: Comparisons between assays and condensates. Mutat Res 650:15–29. - PubMed
-
- EPA. 2005. Guildelines for carcinogen risk assessment. http://www.epa.gov/sites/production/files/2013-09/documents/cancer_guide... (accessed 10/2/2017).
Publication types
MeSH terms
Grants and funding
LinkOut - more resources
Full Text Sources
Other Literature Sources
Medical
Research Materials
