. 2018 Mar;48(3):532-542.
doi: 10.1002/eji.201746976. Epub 2017 Dec 8.

Tumor conditions induce bone marrow expansion of granulocytic, but not monocytic, immunosuppressive leukocytes with increased CXCR2 expression in mice

Affiliations

Tumor conditions induce bone marrow expansion of granulocytic, but not monocytic, immunosuppressive leukocytes with increased CXCR2 expression in mice

Zhen Bian et al. Eur J Immunol. 2018 Mar.

Abstract

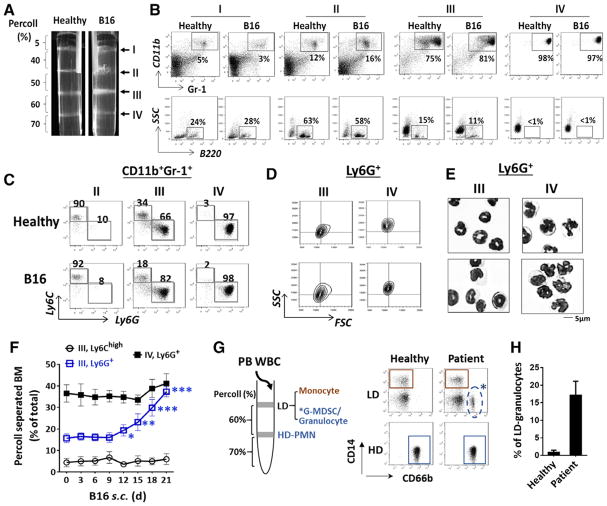
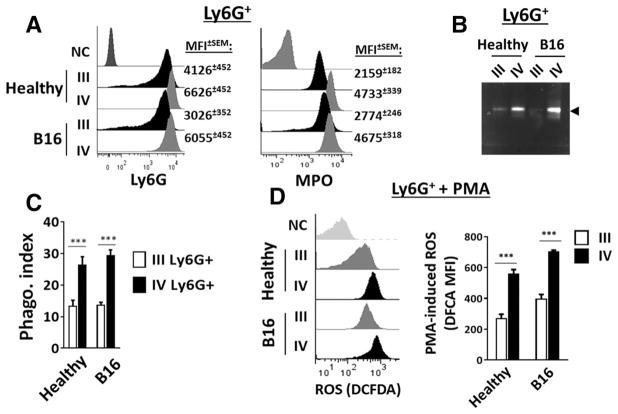
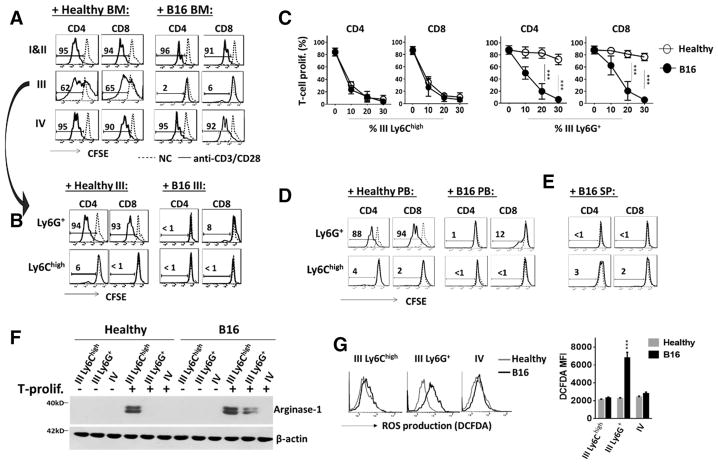
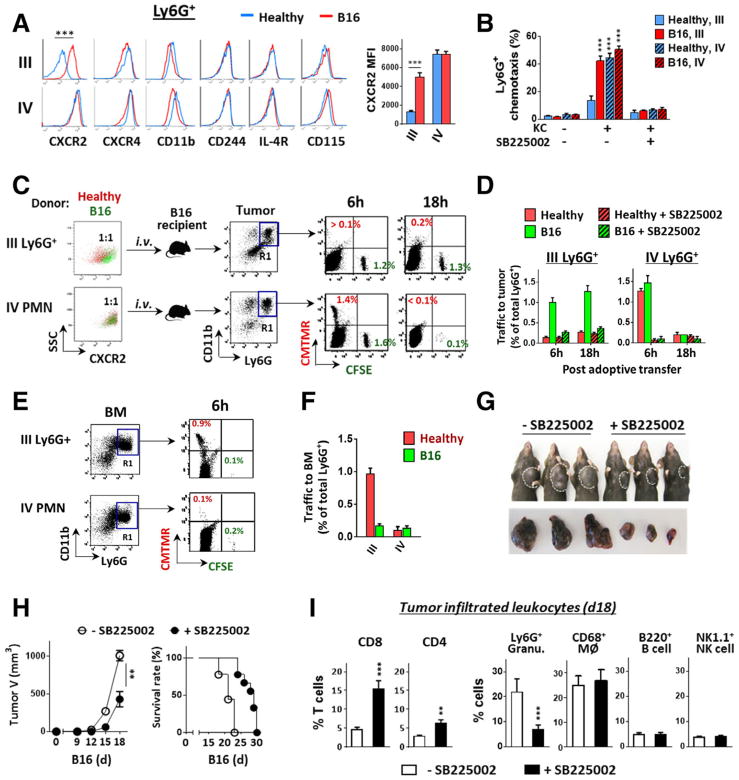
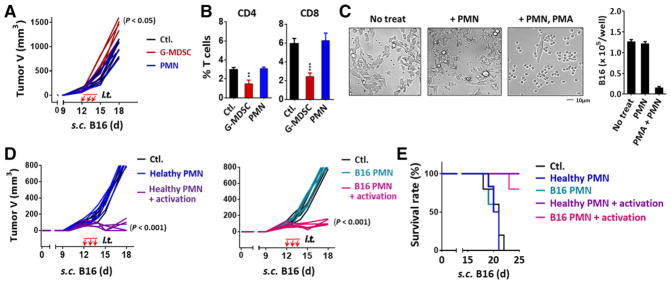
Myeloid-derived suppressor cells (MDSCs) promote tumor growth through, in part, inhibiting T-cell immunity. However, mechanisms underlying MDSC expansion and guidance of MDSCs toward the tumor microenvironment remain unclear. Employing Percoll density gradients, we separate bone marrow (BM) leukocytes from tumor-bearing mice into four density-increasing bands with myeloid leukocytes enriched in bands III and IV. Band III comprises monocytes and low-density granulocytes, both confirmed to be M-MDSCs and G-MDSCs, respectively, by displaying potent inhibition of T-cell proliferation. However, monocytes act as M-MDSCs not only under tumor conditions but also the healthy condition. In contrast, band IV contains non-inhibitory, mature granulocytes. Only band III G-MDSCs display significant expansion in mice bearing B16 melanoma, Lewis lung carcinoma, or MC38 colon carcinoma. The expanded G-MDSCs also show increased CXCR2 expression, which guides egress out of BM, and produce arginase-1 and ROS upon encountering antigen-activated T cells. Adoptive transfer assays demonstrate that both G-MDSCs and mature granulocytes infiltrate tumors, but only the former displays sustention and accumulation. Intratumoral administrations of granulocytes further demonstrate that G-MDSCs promote tumor growth, whereas mature granulocytes exert minimal effects, or execute powerful anti-tumor effects providing the presence of PMN activation mechanisms in the tumor microenvironment.

Keywords: Bone marrow PMN; Ly6C; Melanoma; Myeloid-derived suppressor cells; Myelopoiesis.


Conflict of interest statement

Conflict of interest: The authors have declared no financial or commercial conflict of interest.

Figures

Figure 1
Figure 1
Separation of bone marrow myeloid leukocytes by Percoll density gradients. (A) Bone marrow cells harvested from healthy and B16 melanoma-bearing mice were applied to discontinuous Percoll density gradients. After centrifugation, four cell-enriched bands, I, II, III, IV, were formed at sequentially increased density interfaces. Representative flow cytometric (B) analyses of cell types in each band. (C) Determination of monocytic and granulocytic cells in the Gr-1+CD11b+ myeloid population by Ly6C and Ly6G labeling. (D) Analyses of Ly6G+ granulocytes in bands III and IV for FSC and SSC values. (E) Giemsa staining of Ly6G+ granulocytes for nuclear morphology. Scale bar: 5 μm. Data in (A–E) are from a single experiment representative of over five independent experiments with three to five mice per experiment. (F) Progressive expansion of band III Ly6G+ granulocytes in mice engrafted with B16 melanoma. (G–H) Separation of human peripheral leukocytes by Percoll density gradients and FACS analyses of granulocytes (CD66+) and monocytes (CD14+) in high density (HD) and low density (LD) fractions. Data in (F, H) are expressed as median ± SEM and represent over five independent experiments with five mice or patients per experiment. The significant differences between the tested groups were calculated by two-tailed paired Student’s t-test. *p ≤ 0.05; **p ≤ 0.01; ***p ≤ 0.001.
Figure 2
Figure 2
Functional characterization of Ly6G+ granulocytes in bands III and IV. (A) Expression of cell surface Ly6G antigen and intracellular MPO. Ly6G+ granulocytes in bands III and IV were directly incubated with an anti-Ly6G antibody to detect cell surface Ly6G or were first permeabilized using Triton prior to incubation with PE-conjugated anti-MPO antibody for MPO detection by flow cytometry. NC: Cells labeled with PE-conjugated goat anti-rat IgG. (B) PMA-induced release of gelatinase activity. The supernatants of PMA-treated Ly6G+ granulocytes were collected and gelatinase activity (arrowhead) was analyzed by zymography. (C) Phagocytosis toward Alexa Fluor-conjugated E. coli. (D) PMA-induced ROS production determined by DCFDA staining. Data demonstrated in C and D are expressed as median ± SEM and represent over five independent experiments with over five mice per experiment. The significant differences between the tested groups were calculated by two-tailed paired Student’s t-test. ***p ≤ 0.001. Data demonstrated in (A, B and left panel of D) are from a single experiment representative of five independent experiments with at least three mice per experiment.
Figure 3
Figure 3
MDSC activity in different myeloid populations. (A) Assay for bone marrow leukocyte-mediated inhibition of T-cell proliferation. Splenic T cells (labeled with CFSE) were induced for proliferation by ligating CD3 and CD28 followed by incubation at 37°C. After 4 days, positive proliferation was determined by the CFSE dilution toward a lower fluorescence intensity. To test leukocytes-mediated inhibition, bone marrow leukocytes from healthy and B16 melanoma mice separated by Percoll gradients in bands I and II (combined), III, and IV were added into the T-cell proliferation system at the ratio of 1:4 for leukocytes to splenocytes. (B) Inhibition of T-cell proliferation by band III Ly6G+ granulocytes and Ly6Chigh monocytes. Ly6G selection was performed to separate the band III granulocytes from monocytes prior to testing both cell types in T-cell proliferation assays. (C) Dose-dependent inhibition of proliferation by band III Ly6G+ granulocytes and Ly6Chigh monocytes. (D and E) Testing Ly6G+ granulocytes and Ly6Chigh monocytes from peripheral blood (PB) and spleen (SP) for inhibition of T-cell proliferation. (F) Western blot detecting arginase-1 in band III and IV bone marrow leukocytes before (−) and after (+) co-culturing these cells with CD3/CD28-ligated T cells. (G) Induced ROS production in G-MDSCs by proliferating T cells. The band III and IV bone marrow leukocytes from different mice were co-cultured with CD3/CD28-ligated T cells in the presence of DCFDA for 6 h. ROS production indicated by positive DCFDA staining was evaluated by flow cytometry. Flow cytometry data in A, B, D, G are from one experiment representative of at least three experiments with over six mice per experiment. Statistical data in C and G are expressed as median ± SEM and represent at least three experiments with over six mice per experiment. The significant differences between the tested groups were calculated by two-tailed paired Student’s t-test. ***p ≤ 0.001.
Figure 4
Figure 4
Increased CXCR2 expression on G-MDSCs directs egress out of bone marrow into tumors. (A) Isolated bone marrow band III and IV Ly6G+ granulocytes from healthy and melanoma-bearing mice were detected for cell surface markers by flow cytometry. (B) G-MDSC and PMN chemotaxis toward CXCL1 (KC). In vitro chemotaxis assays were performed using transwell setups toward KC in the presence or absence of a CXCR2 antagonist SB225002). (C–F) In vivo granulocyte trafficking to B16 melanoma. Isolated band III Ly6G+ granulocytes and band IV mature PMN were labeled with fluorescence dye, CMTMR (red) for those originated from healthy mice, or CFSE (green) for those originated from melanoma-bearing mice. Mixed red and green (1:1 ratio) granulocytes of band III or IV were then transferred i.v. into melanoma-bearing recipient mice (tumor size ~ 500 mm3), without or along with SB225002. At 6 and 18 h post transfer, melanoma tumors (C and D) and femur bones (E–F) were excised and analyzed for colored granulocytes within CD11b+Ly6G+ cells (R1 gating), indicating donor Ly6G+ granulocyte trafficking. G–I). Mice engrafted with B16 were given (i.p., 3×) SB225002 or vehicle every other day. The effects on tumor growth (G and H), the overall survival rates (H), and the intratumoral T cells and other leukocytes (I) were determined on day 18. Flow data in left panel A, C and E are from a single experiment representative of at least three independent experiments with five mice per experiment. Data in A, B, D, F, H and I are presented as mean ± SEM and represent at least three experiments with more than five mice per experiment. The significant differences between the tested groups were calculated by two-tailed paired Student’s t-test (A, H, I) or one-way ANOVA followed by Dunnett’s Multiple Comparison test (B). **p ≤ 0.01; ***p ≤ 0.001.
Figure 5
Figure 5
Effects of G-MDSCs and mature PMN on tumor growth. (A and B) Isolated G-MDSCs or PMN from bone marrow bands III and IV of melanoma-bearing mice were intratumorally injected (i.t.) into recipient mice that bore melanoma tumors (tumor size ~ 100 mm3) for three consecutive days (days 12, 13, and 14). Tumor growth was recorded (A) and tumor infiltrated T cells were analyzed on day 15 (B). (C) B16 cells were co-cultured with PMN in the absence or presence of PMA for 18 h. (D and E) Bone marrow PMN (band IV) isolated from healthy or tumor-bearing mice were intratumorally injected into recipient melanoma tumors. To activate PMN, a set of mice were given the second injections of a mixture of PMA, zymosan and fMLP. These procedures were performed three times (d 12, 13, and 14). Tumor growth (D) and the overall survival rates (E) were analyzed. Demonstrated data (A–D) represent at least three independent experiments with five or six mice per experiment. Data in B and C are presented as mean ± SEM. The significant differences between the tested groups were calculated by one-way ANOVA followed by Dunnett’s Multiple Comparison test. *p ≤ 0.05; **p ≤ 0.01; ***p ≤ 0.001.

References

    1. Gabrilovich DI, Nagaraj S. Myeloid-derived suppressor cells as regulators of the immune system. Nat Rev Immunol. 2009;9:162–174. - PMC - PubMed
    1. Delano MJ, Scumpia PO, Weinstein JS, Coco D, Nagaraj S, Kelly-Scumpia KM, O’Malley KA, et al. MyD88-dependent expansion of an immature GR-1(+)CD11b(+) population induces T-cell suppression and Th2 polarization in sepsis. J Exp Med. 2007;204:1463–1474. - PMC - PubMed
    1. Cripps JG, Gorham JD. MDSC in autoimmunity. Int Immunopharmacol. 2011;11:789–793. - PMC - PubMed
    1. Talmadge JE, Gabrilovich DI. History of myeloid-derived suppressor cells. Nat Rev Cancer. 2013;13:739–752. - PMC - PubMed
    1. Youn JI, Nagaraj S, Collazo M, Gabrilovich DI. Subsets of myeloid-derived suppressor cells in tumor-bearing mice. J Immunol. 2008;181:5791–5802. - PMC - PubMed

Publication types

MeSH terms

LinkOut - more resources