

Inferring within-herd transmission parameters for African swine fever virus using mortality data from outbreaks in the Russian Federation
- PMID: 29120101
- PMCID: PMC5887875
- DOI: 10.1111/tbed.12748
Inferring within-herd transmission parameters for African swine fever virus using mortality data from outbreaks in the Russian Federation
Abstract
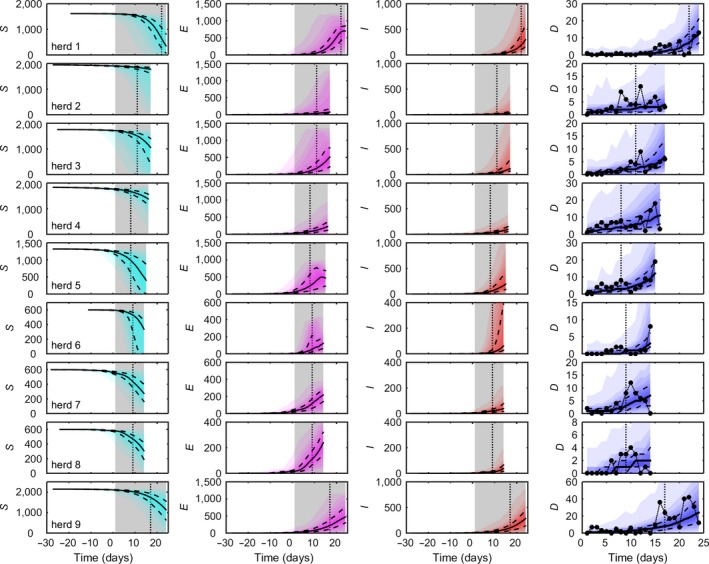
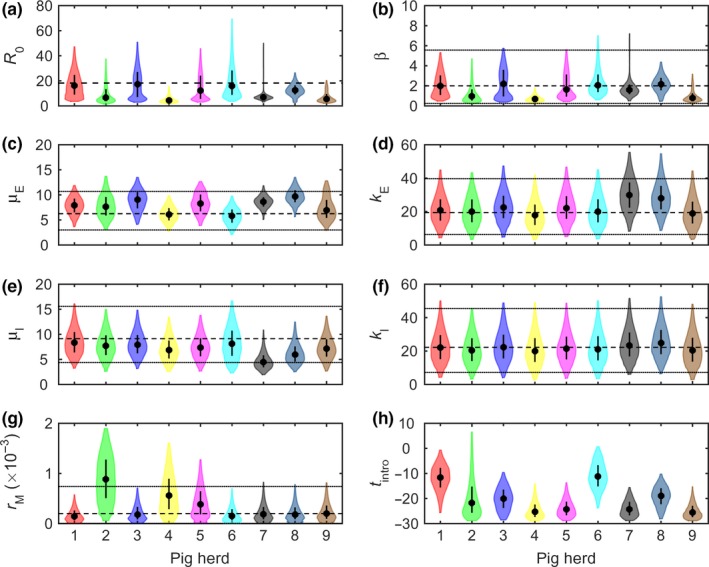
Mortality data are routinely collected for many livestock and poultry species, and they are often used for epidemiological purposes, including estimating transmission parameters. In this study, we infer transmission rates for African swine fever virus (ASFV), an important transboundary disease of swine, using mortality data collected from nine pig herds in the Russian Federation with confirmed outbreaks of ASFV. Parameters in a stochastic model for the transmission of ASFV within a herd were estimated using approximate Bayesian computation. Estimates for the basic reproduction number varied amongst herds, ranging from 4.4 to 17.3. This was primarily a consequence of differences in transmission rate (range: 0.7-2.2), but also differences in the mean infectious period (range: 4.5-8.3 days). We also found differences amongst herds in the mean latent period (range: 5.8-9.7 days). Furthermore, our results suggest that ASFV could be circulating in a herd for several weeks before a substantial increase in mortality is observed in a herd, limiting the usefulness of mortality data as a means of early detection of an outbreak. However, our results also show that mortality data are a potential source of data from which to infer transmission parameters, at least for diseases which cause high mortality.
Keywords: approximate Bayesian computation; disease control; epidemiology; modelling; mortality data; pigs.
© 2017 The Authors. Transboundary and Emerging Diseases Published by Blackwell Verlag GmbH.
Figures
References
-
- Anderson, D. , & Watson, R. (1980). On the spread of a disease with gamma distributed latent and infectious periods. Biometrika, 67, 191–198.
-
- Backer, J. A. , Brouwer, H. , van Schaik, G. , & van Roermund, H. J. W. (2011). Using mortality data for early detection of classical swine fever in The Netherlands. Preventive Veterinary Medicine, 99, 38–47. - PubMed
-
- Blome, S. , Gabriel, C. , & Beer, M. (2013). Pathogenesis of African swine fever in domestic pigs and European wild boar. Virus Research, 173, 122–130. - PubMed
MeSH terms
Grants and funding
LinkOut - more resources
Full Text Sources
Other Literature Sources
