. 2017 Nov 9;551(7679):237-241.
doi: 10.1038/nature24626. Print 2017 Nov 9.

Ultra-selective looming detection from radial motion opponency

Affiliations

Ultra-selective looming detection from radial motion opponency

Nathan C Klapoetke et al. Nature. .

Abstract

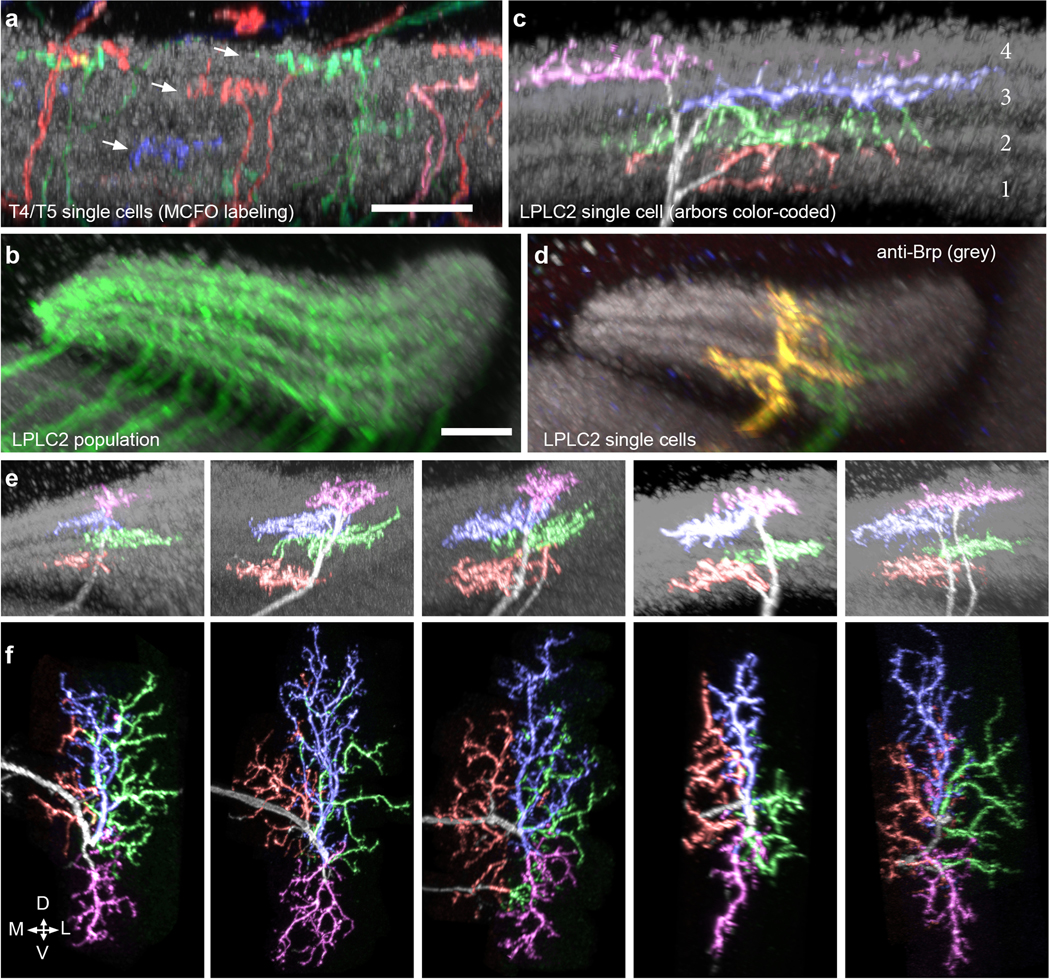
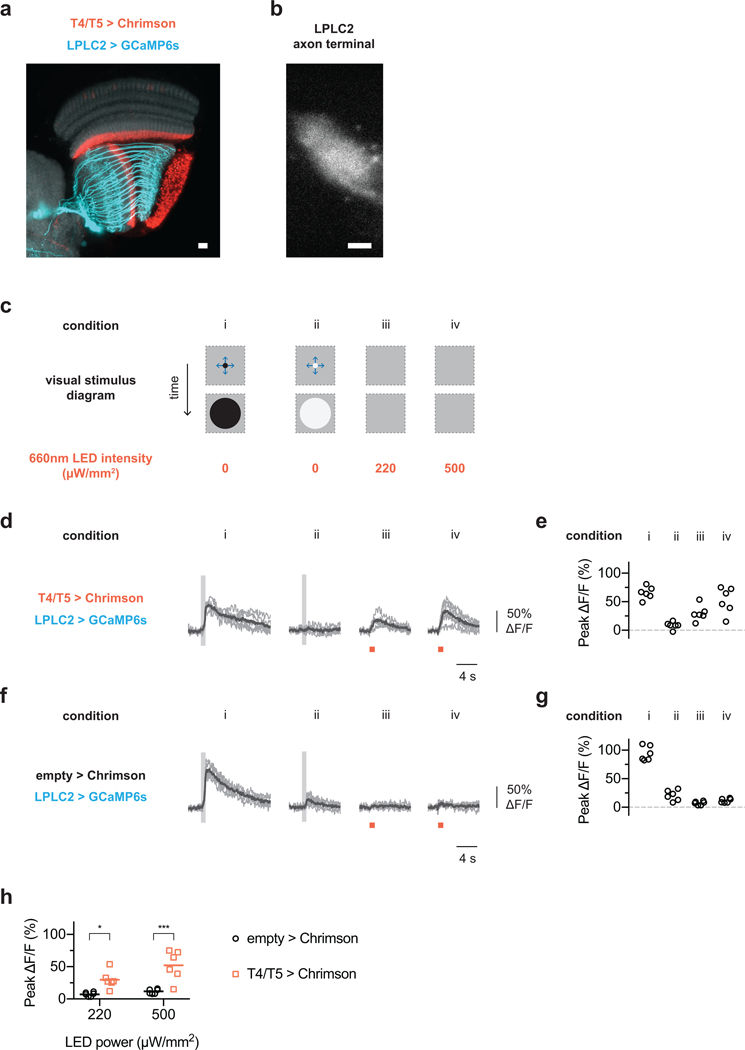
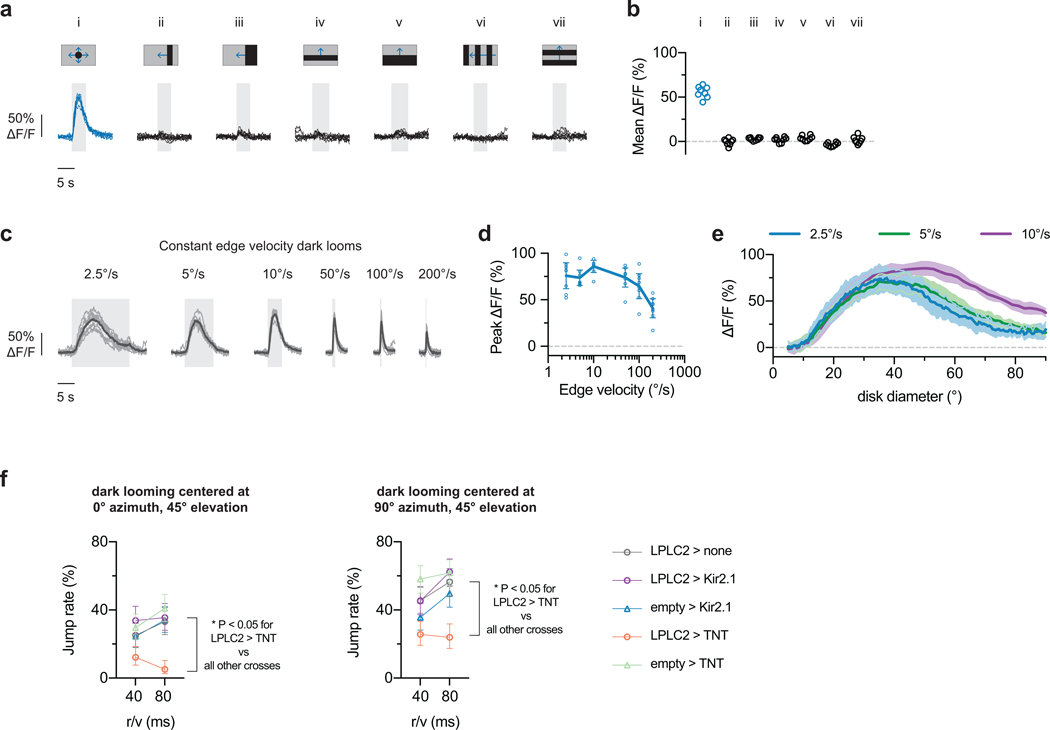
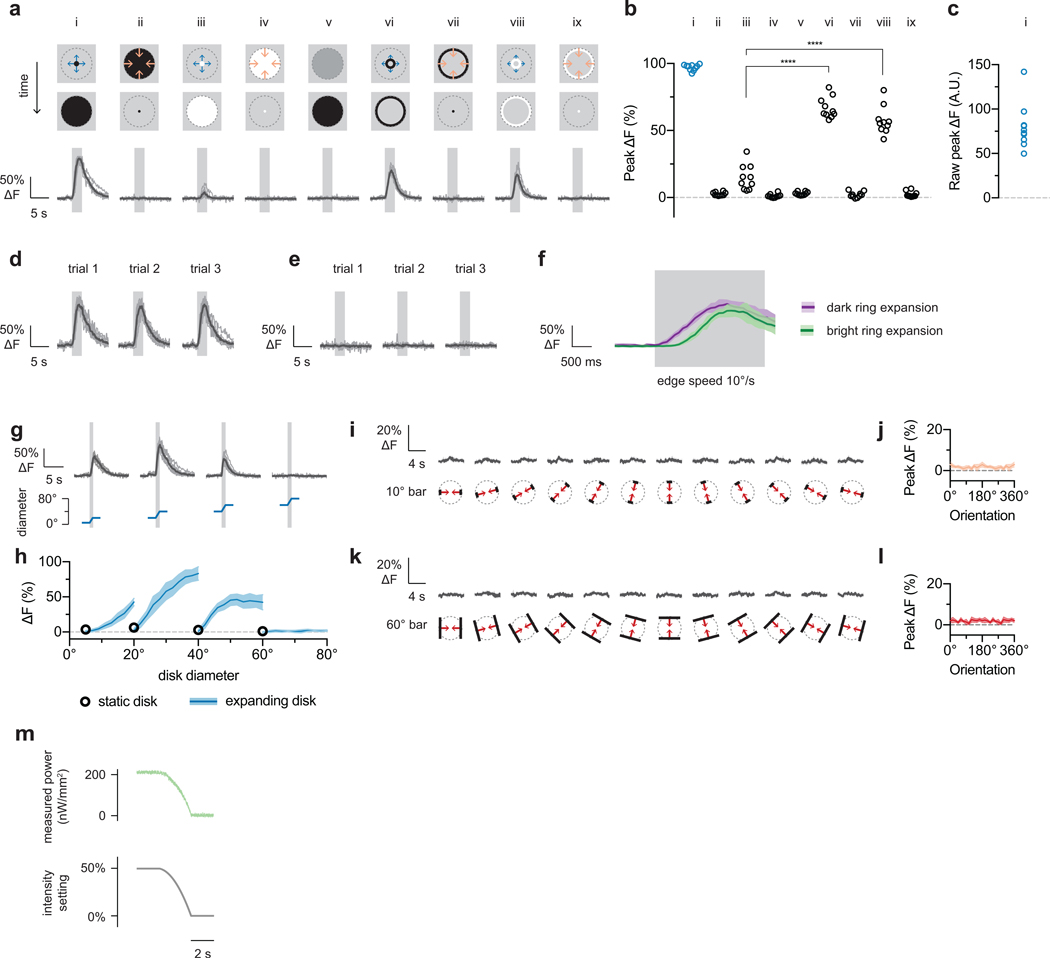
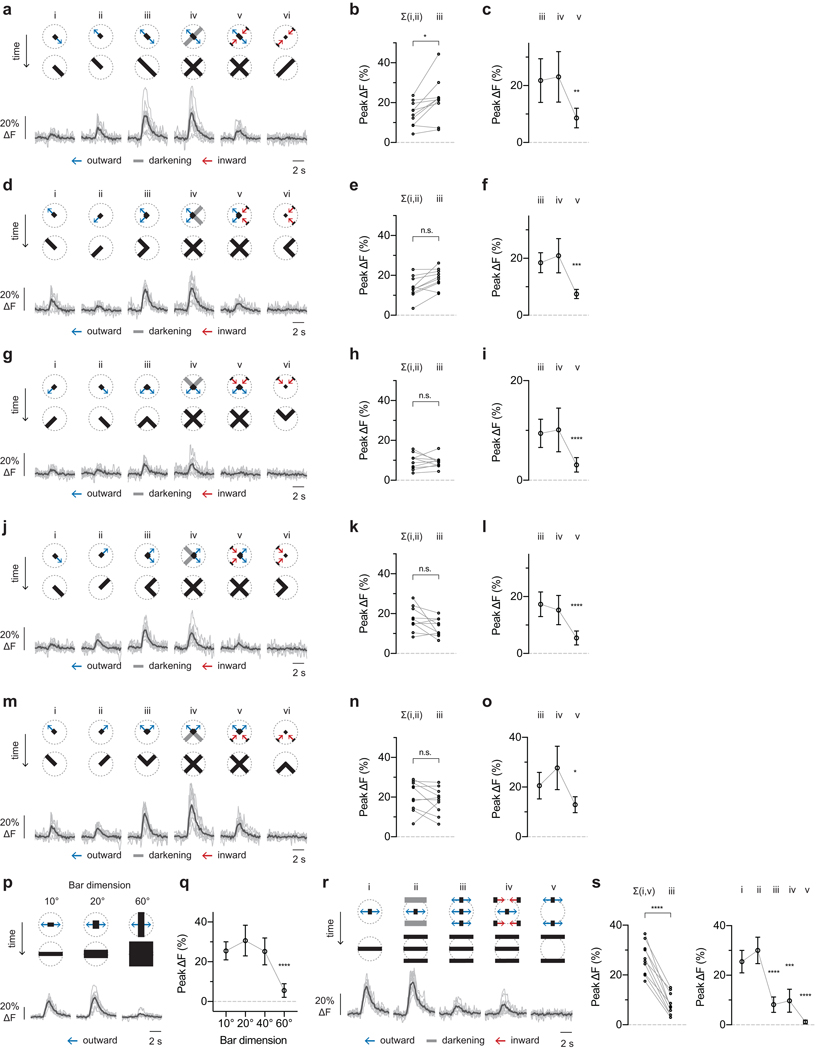
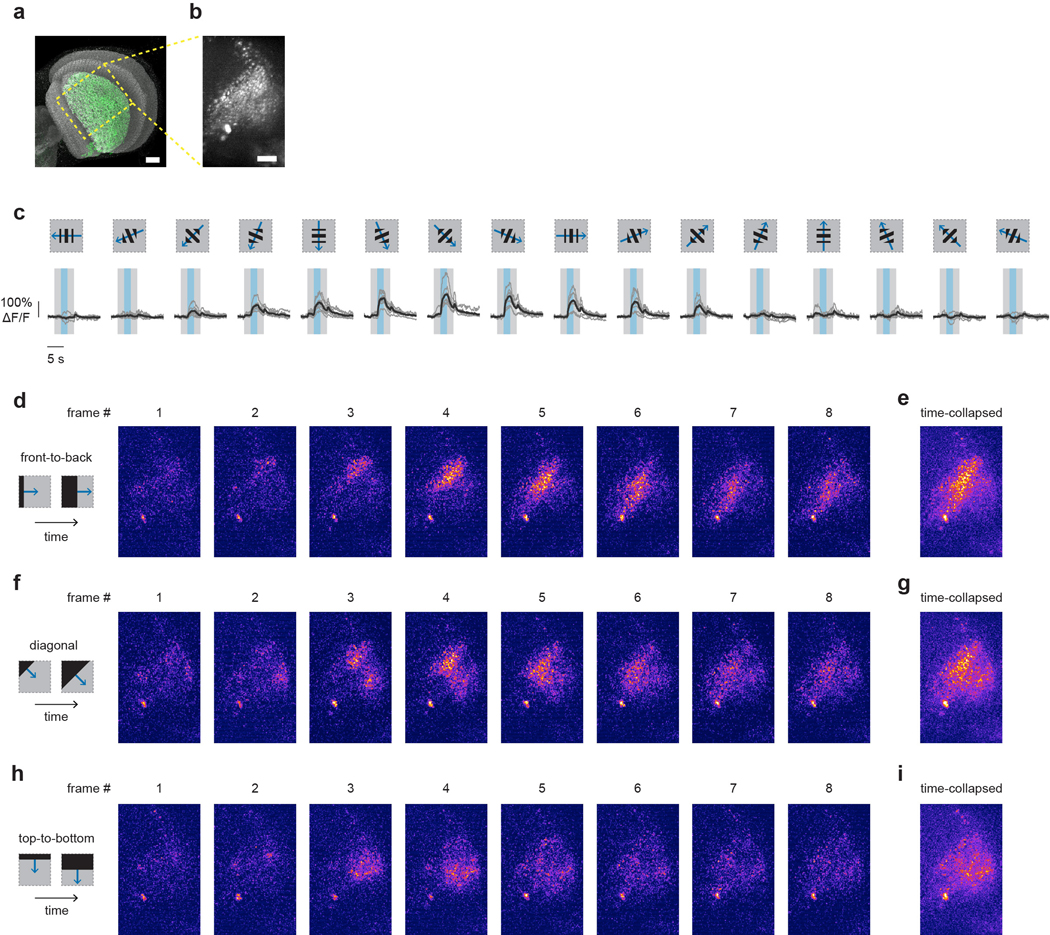
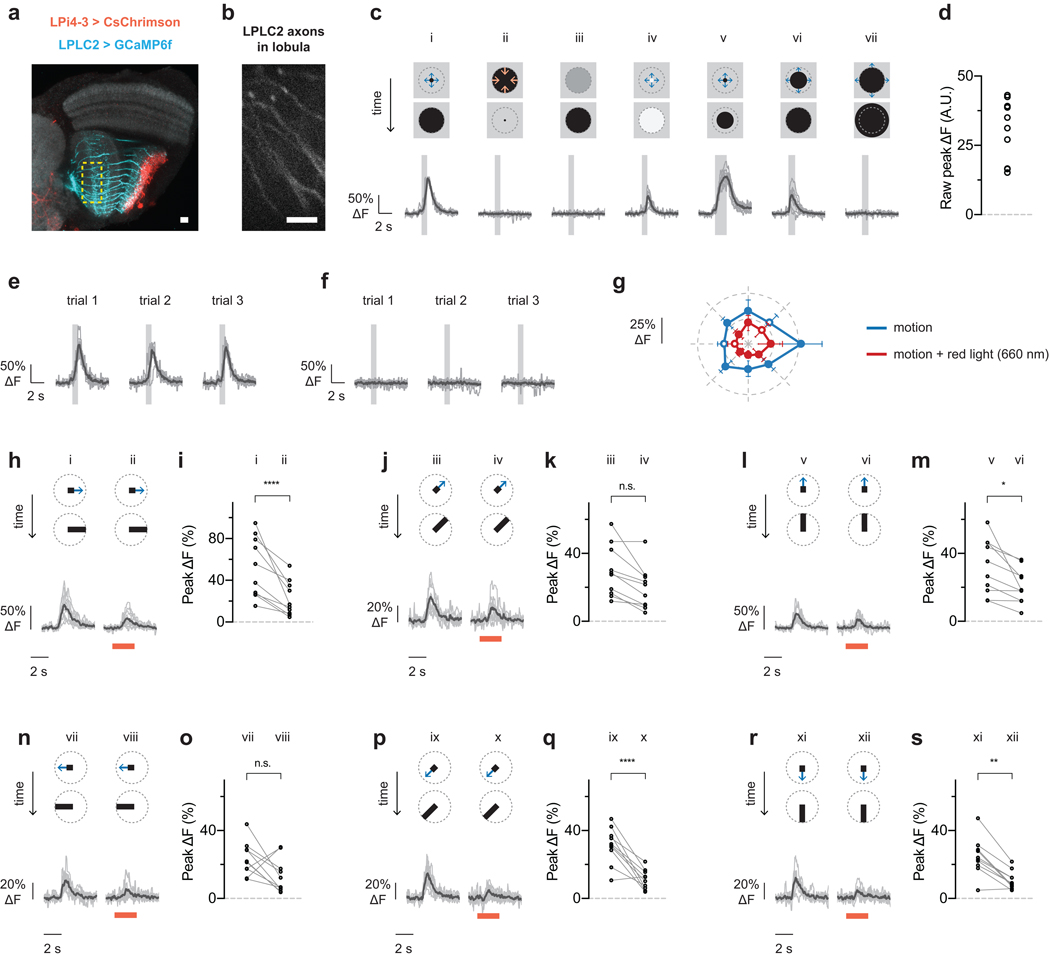
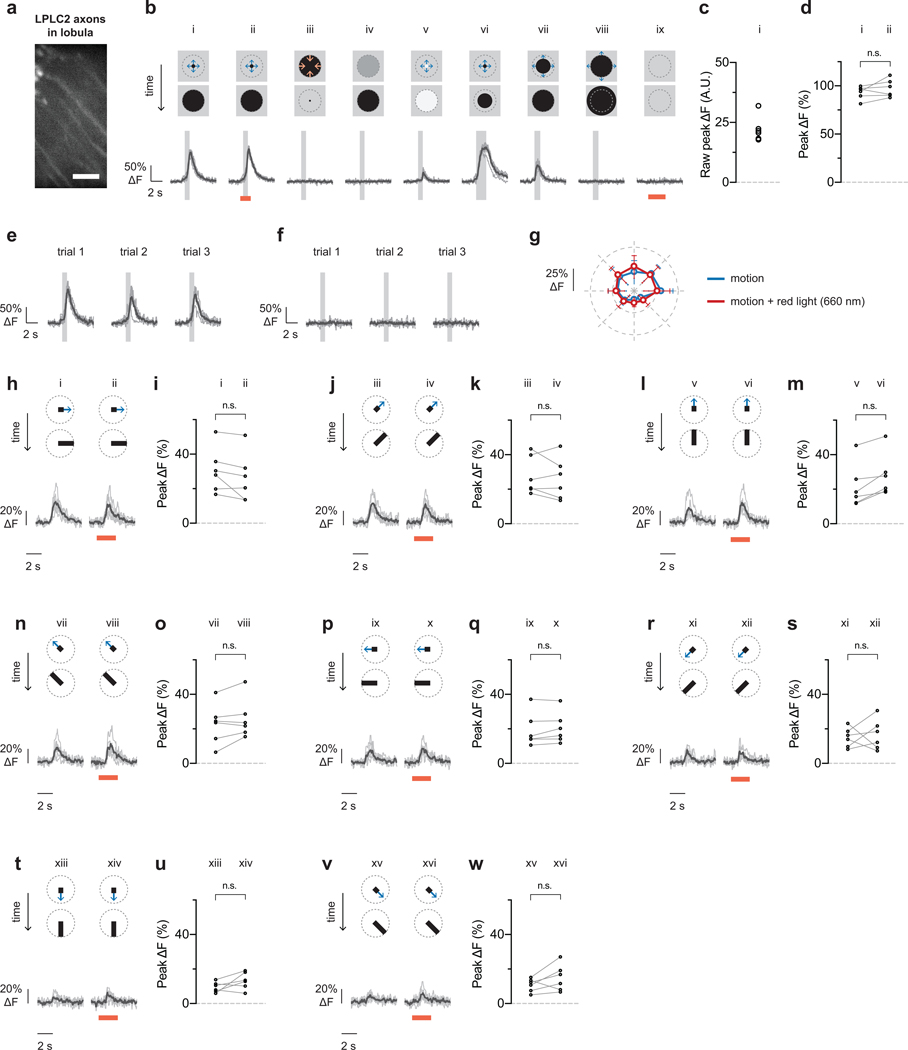
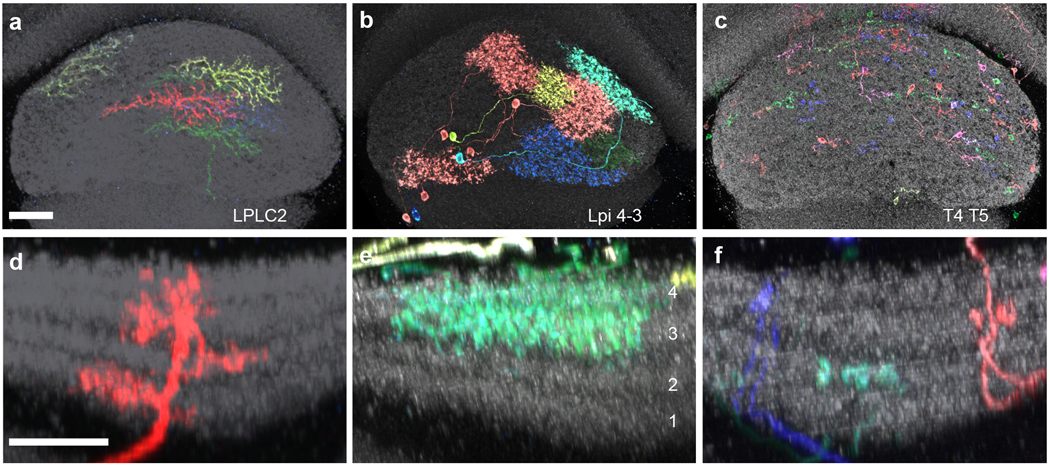
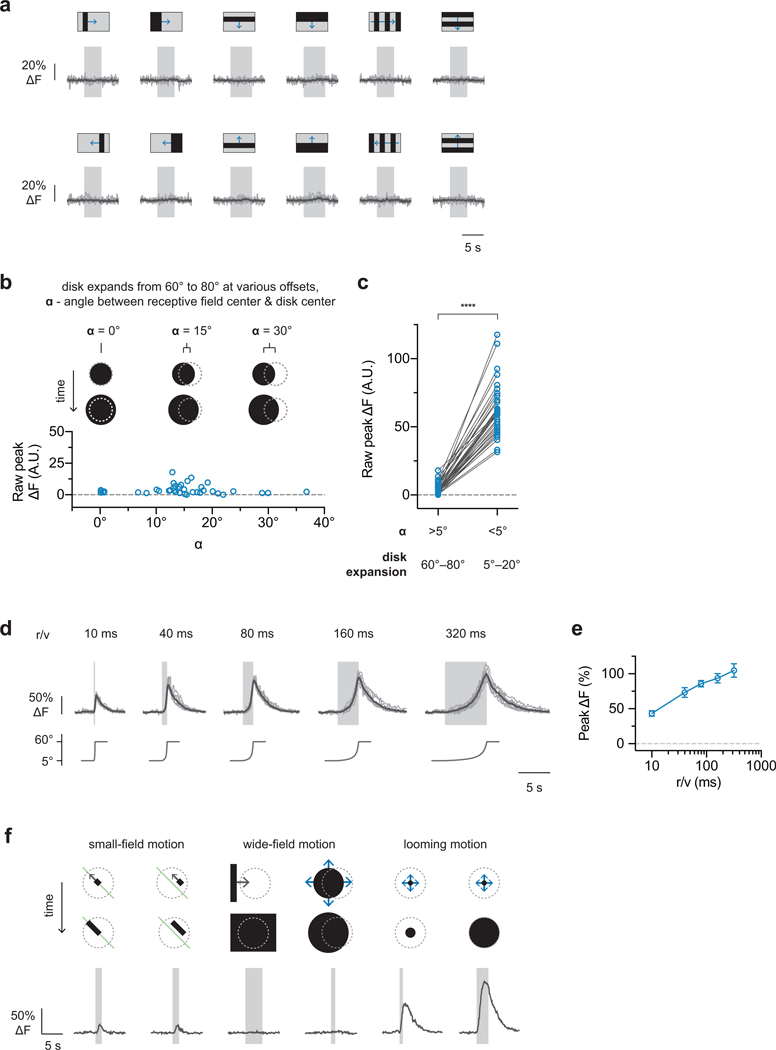
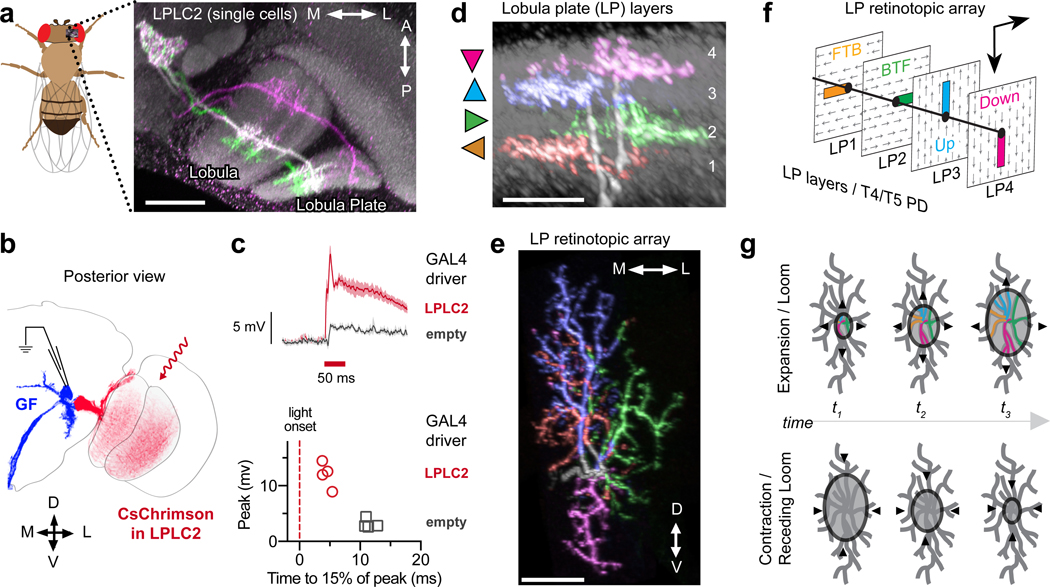
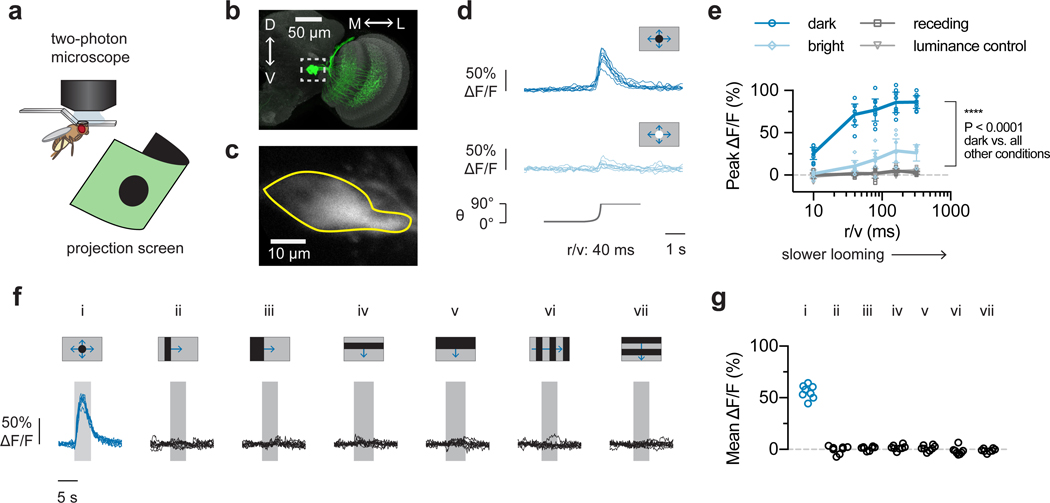
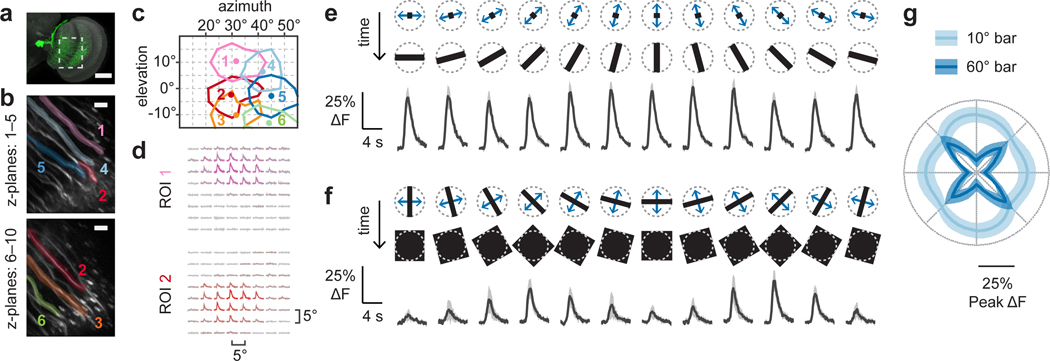
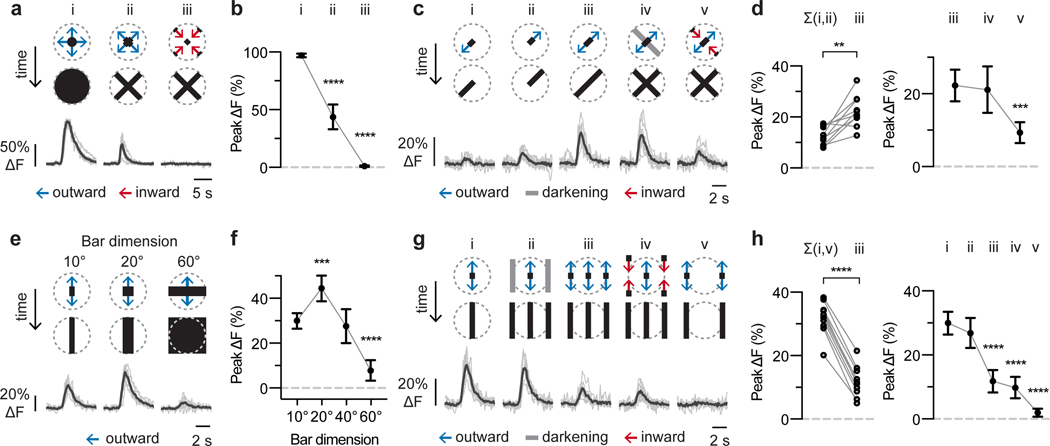
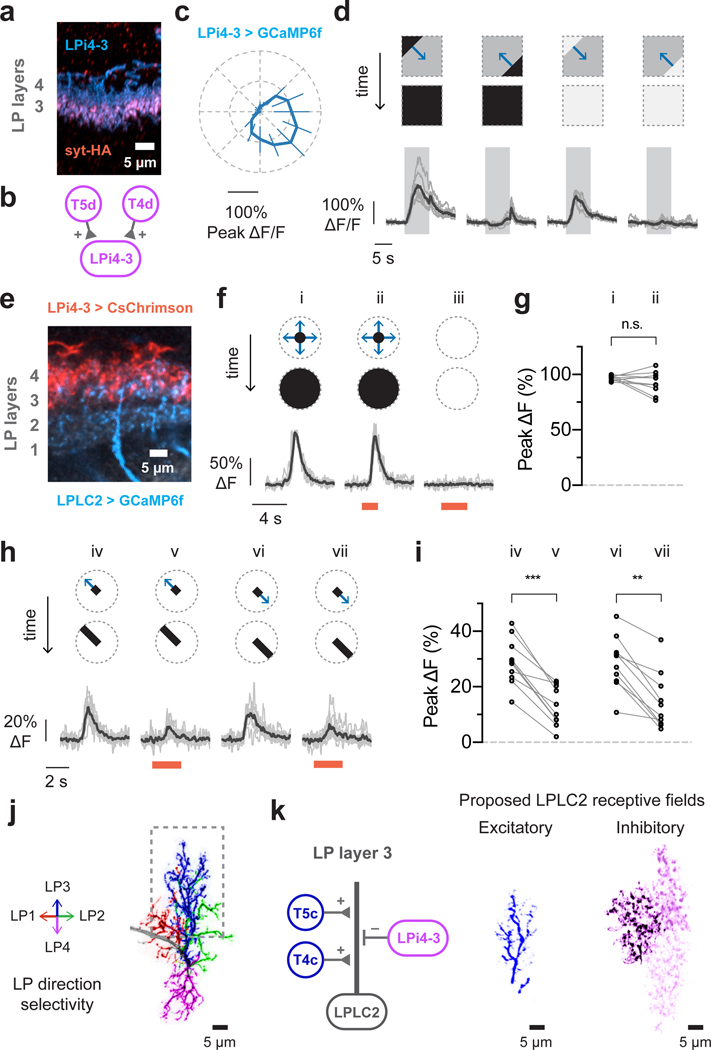
Nervous systems combine lower-level sensory signals to detect higher-order stimulus features critical to survival, such as the visual looming motion created by an imminent collision or approaching predator. Looming-sensitive neurons have been identified in diverse animal species. Different large-scale visual features such as looming often share local cues, which means loom-detecting neurons face the challenge of rejecting confounding stimuli. Here we report the discovery of an ultra-selective looming detecting neuron, lobula plate/lobula columnar, type II (LPLC2) in Drosophila, and show how its selectivity is established by radial motion opponency. In the fly visual system, directionally selective small-field neurons called T4 and T5 form a spatial map in the lobula plate, where they each terminate in one of four retinotopic layers, such that each layer responds to motion in a different cardinal direction. Single-cell anatomical analysis reveals that each arm of the LPLC2 cross-shaped primary dendrites ramifies in one of these layers and extends along that layer's preferred motion direction. In vivo calcium imaging demonstrates that, as their shape predicts, individual LPLC2 neurons respond strongly to outward motion emanating from the centre of the neuron's receptive field. Each dendritic arm also receives local inhibitory inputs directionally selective for inward motion opposing the excitation. This radial motion opponency generates a balance of excitation and inhibition that makes LPLC2 non-responsive to related patterns of motion such as contraction, wide-field rotation or luminance change. As a population, LPLC2 neurons densely cover visual space and terminate onto the giant fibre descending neurons, which drive the jump muscle motor neuron to trigger an escape take off. Our findings provide a mechanistic description of the selective feature detection that flies use to discern and escape looming threats.


Conflict of interest statement

The authors declare no competing financial interests.

Figures

Extended data figure 1:
Extended data figure 1:. Additional LPLC2 anatomy.
a, Layer pattern of MCFO-labeled T4 and T5 neurons in the lobula plate (LP). Individual cells arborize in one of the four LP layers (arrows). A neuropil marker (anti-Brp) is shown in grey. The presynaptic terminals of T4/T5 in the LP are mainly located in one of four Brp-rich strata. Scale bar, 10 μm. b-d, LPLC2 cells cover the LP in overlapping patterns. b, As a population, LPLC2 dendrites (green) cover all LP layers. Scale bar, 10 μm. c, Layer pattern for the LPLC2 cell shown in Fig. 1e,g on reference neuropil (grey, anti-Brp). LPLC2 arbors are mainly located in the Brp-rich layers that also contain the bulk of the presynaptic terminals of T4/T5 in the LP (see a). Branches were manually colored based on layer position. d, MCFO-labeling of two LPLC2 cells in the LP. Note the different positions of the layer 1 and layer 2 branches of the two cells. e-f, Additional examples of images of LPLC2 cells; images processed and displayed as in Fig. 1d,e. Although details of the branching patterns vary, the general pattern of layer specific arbor spread appears stereotyped.
Extended data figure 2:
Extended data figure 2:. Functional connectivity between T4/T5 and LPLC2.
a-b, Anatomy of fly transgenic used for functional connectivity experiments. Scale bar, 10 μm. a, Representative confocal image of Chrimson-expressing T4/T5 cells (red) and GCaMP6s-expressing LPLC2 cells (cyan) overlaid on neuropil marker (N-Cadherin stain, grey). b, Two-photon averaged calcium image showing LPLC2 axon terminal imaging region. c, Experimental conditions for visual stimulus and optogenetic stimulation. Conditions i and ii are looming at r/v = 40 ms, whereas conditions iii and iv have a static background intensity. d-e, Fly (N = 6) responses to visual and optogenetic stimuli. Individual fly responses are in grey and population average in black. Grey box indicates looming motion period. Red bar indicates red light stimulation period. e, Peak calcium response plotted for individual flies (circles) corresponding to measurements in (d). f-g, Enhancerless GAL4 control fly (N = 6) responses to visual and optogenetic stimuli. h, Comparison of peak calcium responses to red light between empty (f-g) and T4/T5 (d-e) GAL4 driver lines. Individual fly responses (symbols) overlaid on population mean (line). Two-way ANOVA with Bonferroni’s post hoc test. * P < 0.05, *** P < 0.001.
Extended data figure 3:
Extended data figure 3:. Population LPLC2 looming selectivity and speed tuning.
a-e, LPLC2 axon terminal population calcium responses to dark looming and wide-field motion stimuli (N = 8 flies). Grey box on traces indicates stimulus motion period. a-b, Constant edge velocity looming (condition i, blue traces, 5°−60° expansion, 10°/s edge speed) and wide-field motion stimuli (condition ii-vii, black traces, 20°/s edge speed, 10° bar size in all applicable conditions). c-e, Constant edge velocity looming responses at the indicated speeds. Response during stimulus presentation is plotted either as peak fluorescence (d) or as instantaneous fluorescence as a function of disk diameter (e). d, Population mean ± 95% CI, with overlaid individual fly responses. e, Mean response (line) and 95% CI (shaded region). f, Looming-evoked escape rate under different effectors modulating LPLC2 activity or transmission. A total of 2811 flies were assayed, with N > 130 flies in each condition shown (see Supplementary Table 3 for detailed statistics). Circle is jump rate; error bars are 95% CI. * P < 0.05 Tukey’s HSD test.
Extended data figure 4:
Extended data figure 4:. Single-cell LPLC2 receptive-field-centered responses.
a-l, LPLC2 single axon responses to various dark/bright disk or ring stimuli (n = 10 neurons, N = 7 flies). All calcium traces shown depict individual neurons in grey and population average in black unless otherwise specified. Dashed grey circle in visual stimulus diagrams represents the measured 60° diameter upper limit of the LPLC2 receptive field. Overlaid grey box on calcium traces indicates motion stimulus period. Each neuron’s response is normalized to its dark looming response (i, 5° to 60° expansion). All dark and bright motion stimuli used constant edge velocity (10°/s). Ring stimuli have fixed width of 5° (the difference between inner and outer radius). b-c, Individual neuron responses shown as circles. RM-ANOVA with Bonferroni’s post hoc test. **** P < 0.0001. d-e, Individual trial traces in response to expansion stimulus (ai) are shown in (d), and in response to contraction stimulus (aii) are shown in (e). f, Dark versus bright ring expansion traces (population mean and 95% CI). g-h, Receptive field size mapping. g, Calcium responses (top) to various size disk expansions (bottom). h, Calcium transients during pre-expansion static disk display (circle) and during-expansion responses plotted as a function of disk diameter (population mean ± 95% CI). i-l, One-dimensional inward bar motion responses for 10° (i,j) and 60° bars (k,l). Traces shown in (i,k) and plotted data in (j,l) are population average (dark) and 95% CI (light). m, Power measured at projection screen surface for darkening stimulus (av). Each data point is averaged over a 5.55 ms bin, corresponding to a single projector frame time.
Extended data figure 5:
Extended data figure 5:. Further decomposition of excitatory and inhibitory inputs to LPLC2.
Decomposition of motion along cardinal axes (a-o) or between cardinal axes (p-s) from the same neurons as Fig. 4 (n = 10 neurons, N = 7 flies). Calcium traces are population average (black) and individual neurons (grey). Statistics analyzed using RM-ANOVA with specified post hoc test throughout. Population plots are mean and 95% CI. * P < 0.05, ** P < 0.01, *** P < 0.001, **** P < 0.0001. a-j, Calcium traces and statistics are matched across each row (i.e. a-c, d-f, etc.). Statistics plots on the left (b,e,h,k,n) compare the linear sum of individual responses (i,ii) to the measured combined response (iii), with individual neurons shown as circles and Bonferroni’s post hoc test. Statistics plots on the right (c,f,i,l,o) show the effect of orthogonal axis darkening and inward motion, Dunnett’s post hoc test using reference iii. p-q, Effects of bar width on expansion between cardinal axes. Dunnett’s post hoc test, reference 10° bar response. r-s, Decomposing responses to motion between cardinal axes. s, left, Comparison of the linear sum of individual responses at the receptive field center (i) and edges (v) versus the measured response to expansion in both areas (iii). Individual neurons shown as circles. Bonferroni’s post hoc test. s, right, Comparison of motion at the edge versus center of the receptive field. Dunnett’s post hoc test, reference i.
Extended data figure 6:
Extended data figure 6:. LPi4-3 directional tuning.
a, LPi4-3 (green) expression pattern in the LP and the approximate region imaged with two-photon (yellow box). Scale bar, 20 μm. b, Two-photon maximum z-projection (60 μm depth). Scale bar, 20 μm. c, Directional tuning with 1 Hz temporal frequency square-wave grating displayed within a 50° square aperture. Overlaid bars represent stimulus onset (grey) and period of motion (blue). Individual fly responses shown in dark grey and population average shown in black (N = 6 flies). d-i, Spatially and temporally filtered calcium images (median filtered and temporally binned by 4 volumes) in response to dark edge motion along the directions indicated from one representative fly. Five other flies showed a similar response. All images are shown on the same intensity scale. Each frame (d,f,h) spans approximately 700 ms. The time-collapsed maximum projection images (e,g,i) show that different LPi4-3 boutons respond to front-to-back (e) versus top-to-bottom (i) edge motion, indicating a difference in directional preference.
Extended data figure 7:
Extended data figure 7:. Effect of LPi4-3 depolarization on LPLC2 visual response properties.
LPLC2 single-cell visual responses in transgenic flies expressing CsChrimson in LPi4-3 cells and GCaMP6f in LPLC2 cells (n = 10 neurons, N = 7 flies). Calcium traces shown for individual neurons (grey) and population average (black) throughout. Each neuron’s response is normalized to its dark looming response (ci, 5° to 60° expansion at r/v = 40 ms) throughout the figure. Overlaid light grey bar on calcium traces indicates motion stimulus period. Red bar indicates red light stimulation period. a, Maximum intensity projection image of CsChrimson-expressing LPi4-3 cells (red) and GCaMP6f-expressing LPLC2 cells (cyan) overlaid on neuropil marker (grey, N-Cadherin stain). Scale bar, 10 μm. b, Two-photon imaging region is restricted to LPLC2 axons in the lobula. Scale bar, 10 μm. c-s, Visual responses to receptive-field-centered stimuli. c, Stimulus diagram (top) and calcium response (bottom) for constant approach velocity looming (i-iv, r/v = 40 ms) and constant edge expansion (v-vii, 10°/s edge speed). d, Raw peak calcium responses to stimulus (ci) used for normalization are shown for each neuron. e, Individual trial responses to stimulus (ci). f, Individual trial responses to stimulus (cii). g-s, Comparison of visual responses with or without red light (660 nm) stimulation (see Methods). Directional tuning with a 10° bar expanding outward at 20°/s along the indicated directions. RM-ANOVA with Bonferroni’s post hoc test. * P < 0.05, ** P < 0.01, **** P < 0.0001. g, Polar plot summary (means ± 95% CI). Statistically significant data points (P < 0.05) are drawn as closed circles, insignificant data points are drawn as open circles. h-s, Detailed single cell traces and comparisons. Individual neurons depicted as circles in statistical comparisons.
Extended data figure 8:
Extended data figure 8:. Controls for LPi4-3 optogenetic modulation experiments.
Single-cell visual responses from control flies with an LPLC2-driven GCaMP6f and an enhancerless GAL4-driven CsChrimson (n = 6 neurons, N = 6 flies). Calcium traces shown for individual neurons (grey) and population average (black) throughout. Each neuron’s response is normalized to its dark looming response (bi, 5° to 60° expansion at r/v = 40 ms) throughout the figure. Overlaid light grey bar indicates motion stimulus period. Red bar indicates red light stimulation period. a, Representative calcium image from LPLC2 axons in the lobula. Scale bar, 10 μm. b-f, Visual responses to receptive-field-centered stimuli. b, Stimulus diagram (top) and calcium response trace (bottom) for constant approach velocity looming (i-v, r/v = 40 ms) and constant edge expansion (vi-viii, 10°/s edge speed). c, Raw peak calcium responses to stimulus used for normalization (bi) are shown for individual neurons. d, Effect of red light on looming responses (P = 0.2237, paired t-test, two-sided). e, Individual trial responses to stimulus (bi). f, Individual trial responses to stimulus (biii). g-w, Comparison of visual responses with or without red light (660 nm) stimulation. Directional tuning with a 10° bar expanding outward at 20°/s along the indicated directions. RM-ANOVA with Bonferroni’s post hoc test, * P < 0.05. g, Polar plot summary (means ± 95% CI). Statistically significant data points (P < 0.05) are drawn as closed circles, insignificant data points are drawn as open circles. h-w, Detailed single cell traces and comparisons. Individual neurons depicted as circles in statistical comparisons.
Extended data figure 9:
Extended data figure 9:. Size and layer pattern of LPLC2 cells and putative inputs to LPLC2 dendrites.
a-c, En face views of the LP from posterior show the spread of MCFO-labeled LPLC2 (a), LPi 4–3 (b), and T4/T5 (c) cells. Note the much larger spread of LPi cells compared to T4/T5 cells. Scale bars, 20 μm. d-f, LP layer pattern of LPLC2 (d), LPi4-3 (e), and T4/T5 cells (f). As previously described, LPi cells project between layers with opposing T4/T5 preferred direction. Scale bar in d, 10 μm. Since LP depth is not uniform, images in d-f are shown at similar but slightly different scale to facilitate comparison of layer patterns between images. Anti-Brp is shown in grey.
Extended data figure 10:
Extended data figure 10:. LPLC2 single-cell responses to null stimuli and looming motion.
a, Wide-field translational motion stimuli (20°/s edge speed, 10° bar size in all conditions except pure edge motion). Individual neuron in grey, population average in black. n = 10 neurons from 7 flies. b, Constant edge velocity (10°/s) disk expansion (60° to 80°) at various distances between disk center and receptive field center (each blue circle represents a different neuron, n = 40 neurons, N = 7 flies). c, Paired comparison for off-centered disk expansion (ɑ > 5°, 60° to 80° disk diameter) versus on-centered disk expansion (ɑ < 5°, 5° to 20° disk diameter). The off-centered disk expansion is from b; the on-centered disk expansion is the peak response from receptive field center mapping (as depicted in Fig. 3b–d). Paired t-test two-sided. **** P < 0.0001. d-e, Constant approach-velocity looming. Individual neurons in grey, population average in black. Tuning curve is population mean and 95% CI. n = 10 neurons, N = 7 flies. f, Representative traces from a single LPLC2 neuron in response to different types of dark edge motion. Left panel: outward edge motion along a single cardinal direction (left) or 15° offset from the cardinal axis (right). Cardinal axis denoted with a single green line. Middle panel: dark edge motion (left) and off-center disk expansion (right) on the order of receptive field size. Right panel: receptive-field-centered disk expansions from an initial diameter of 5° to a final diameter of 20° (left) or 60° (right).
Figure 1:
Figure 1:. LPLC2 anatomy and connectivity.
a, Stochastically-labeled LPLC2 neurons on reference neuropil (grey). See Methods and Supplementary Table 2. Scale bar, 30 μm. b-c, Giant fiber (GF) responses to optogenetic depolarization of LPLC2, recorded with whole-cell patch-clamp. c, GF membrane potential time course (top: mean and 95% confidence interval, CI) and peak values (bottom: individual neurons). N = 4 flies for each group. d-e, Lobula plate layer pattern (d) and within-layer dendritic arbor spread (e) for a single LPLC2 neuron. Triangles in (d) indicate the preferred direction of T4/T5 neurons in that layer. Lateral (L) in the LP corresponds to frontal in the visual field, dorsal (D) to upwards. Scale bar, 10 μm. f, Schematic showing relative positions of LPLC2 dendrites (colored rectangles) in each LP layer, with each layer’s preferred direction indicated as arrows. FTB, front-to-back; BTF, back-to-front. g, Anatomy-based model of LPLC2 response to looming, where responses are driven by expansion but not contraction (color indicates excitation).
Figure 2:
Figure 2:. LPLC2 population selectively encodes looming stimuli.
a, Imaging setup. b, LPLC2 neurons (green) on reference neuropil (grey); dashed box indicates axon terminal region. c, LPLC2 axon terminal calcium fluorescence; Region of interest (ROI) outlined in yellow. d-e, LPLC2 population looming responses. N = 8 flies. d, Individual fly calcium transients for dark (top) and bright (middle) looming (bottom, disk diameter). Calcium traces shown throughout paper are average of 3 trials. e, Peak responses to a range of looming speeds (mean ± 95% CI, overlay: individual flies). RM-ANOVA, Tukey’s post hoc test. f-g, Individual responses (N = 8 flies) to constant edge velocity looming (i, blue, 10°/s edge speed) and wide-field motion stimuli (ii-vii, black, 20°/s edge speed). Mean responses (g) measured during stimulus presentation (f, grey regions).
Figure 3:
Figure 3:. LPLC2 single-cell receptive field mapping and directional tuning.
a, LPLC2 (green) individual axon imaging region (dashed box). Scale bar, 50 μm. b-d, Single-cell receptive field (RF) mapping from a representative fly. b, Single-cell ROIs overlaid on averaged calcium images. Scale bar, 10 μm. c, RF contour plot: lines at 50% integrated ΔF, dots at fitted RF centers. Grid represents visual field as seen by fly. d, Normalized calcium traces arranged in grid corresponding to (c). e-g, Directional tuning with 10° (e) or 60° (f) 1D bar expansion. n = 10 neurons, N = 7 flies. Population responses shown as mean (line) and 95% CI (shaded). e-f, Dashed circle in stimulus diagrams represents 60° RF diameter upper limit (Extended Data Fig. 4g–h). g, Peak directional tuning responses in polar coordinates.
Figure 4:
Figure 4:. Contributions of excitatory and inhibitory inputs to LPLC2 visual responses.
Decomposition of motion along (a-d) or between (e-h) cardinal axes for individual LPLC2 cells. Stimulus diagram above calcium traces shows motion within receptive field (dashed circle). Bar stimuli have 10° fixed width and 20°/s edge speed unless otherwise specified. Traces are population average (black) and individual neurons (grey). Statistics analyzed using RM-ANOVA with specified post hoc test throughout. Population plots are mean and 95% CI. n = 10 neurons, N = 7 flies. * P < 0.05, ** P < 0.01, *** P < 0.001, **** P < 0.0001. a-b, Responses to disk expansion (i, 10°/s) and outward (ii) or inward (iii) cross motion. Dunnett’s post hoc test, reference i. c-d, Responses to outward motion along a cardinal axis (i-iii) and the effects of luminance (iv) or inward motion (v) on the orthogonal axis. d, left, Comparison of linear sum of individual responses (i,ii) to the measured combined response (iii). Circles, individual neurons. Bonferroni’s post hoc test. d, right, Effects of orthogonal axis darkening and inward motion. Dunnett’s post hoc test, reference iii. e-f, Effects of bar width on expansion between cardinal axes. Dunnett’s post hoc test, reference 10° bar response. g-h, Decomposing responses to motion between cardinal axes. h, left, Comparison of linear sum of individual responses to motion at receptive field center (i) and edges (v) to the measured response during expansion in both areas (iii). Circles, individual neurons. Bonferroni’s post hoc test. h, right, Comparison of motion at the edge versus center of the receptive field. Dunnett’s post hoc test, reference i.
Figure 5:
Figure 5:. Directionally selective inhibitory inputs to LPLC2 further sculpt looming selectivity.
a-d, Lobula plate intrinsic interneuron LPi4-3 anatomy and direction selectivity. Traces are population average (black) and individual flies (grey). N = 7 flies. a, LPi4-3 neurons (cyan) with synaptogamin marker (red). b, Model of LPi4-3 inputs. c, Directional tuning response to moving square-wave gratings. d, Dark or bright edge motion along preferred and null directions. e-i, Effect of LPi4-3 activation on LPLC2. Stimulus diagram above calcium traces shows motion within receptive field (dashed circle). Traces are population average (black) and individual neurons (grey; circle in statistic plots). Red light stimulation is indicated as red bar. n = 10 neurons, N = 7 flies. e, Lobula plate view of LPLC2 (cyan) and LPi4-3 (red). f-g, Looming alone (i, r/v 40 ms) or with red light (ii), and red light stimulation alone (iii). g, Individual neuron responses. P = 0.209, paired t-test (two-sided). h-i, Red-light activation effects on responses to bar stimuli (10° width, 20°/s edge speed). RM-ANOVA with Bonferroni’s post hoc test. ** P < 0.01, *** P < 0.001. j, Single LPLC2 neuron with dendritic branches colored by lobula plate layer and direction selectivity. k, Proposed input model and receptive fields for lobula plate layer 3 (dashed box in j). The inhibitory receptive field image is composed of three neighboring LPi4-3 cells.

Comment in

References

    1. Barlow HB Summation and inhibition in the frog’s retina. The Journal of physiology 119, 69–88 (1953). - PMC - PubMed
    1. Lettvin JY, Maturana HR, McCulloch WS & Pitts WH What the frog’s eye tells the frog’s brain. Proceedings of the IRE 47, 1940–1951 (1959).
    1. Hubel DH & Wiesel TN Receptive fields, binocular interaction and functional architecture in the cat’s visual cortex. The Journal of physiology 160, 106–154 (1962). - PMC - PubMed
    1. Gibson JJ Visually controlled locomotion and visual orientation in animals. British journal of psychology 49, 182–194 (1958). - PubMed
    1. O’Shea M & Williams J The anatomy and output connection of a locust visual interneurone; the lobular giant movement detector (LGMD) neurone. Journal of Comparative Physiology A: Neuroethology, Sensory, Neural, and Behavioral Physiology 91, 257–266 (1974).

Publication types