

Electrophoretic cytometry of adherent cells
- PMID: 29120467
- PMCID: PMC6275091
- DOI: 10.1039/c7lc01012e
Electrophoretic cytometry of adherent cells
Abstract
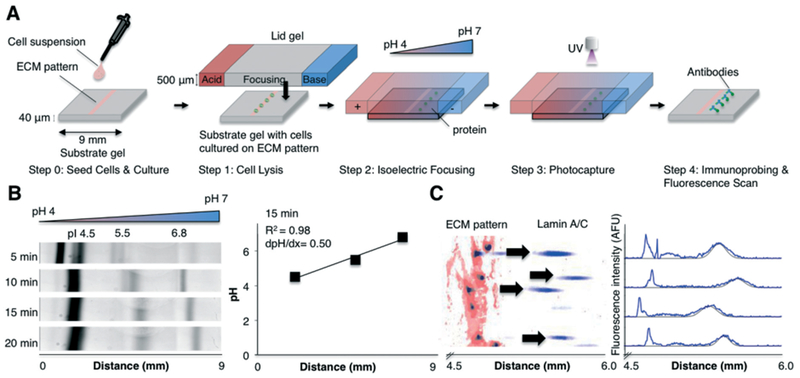
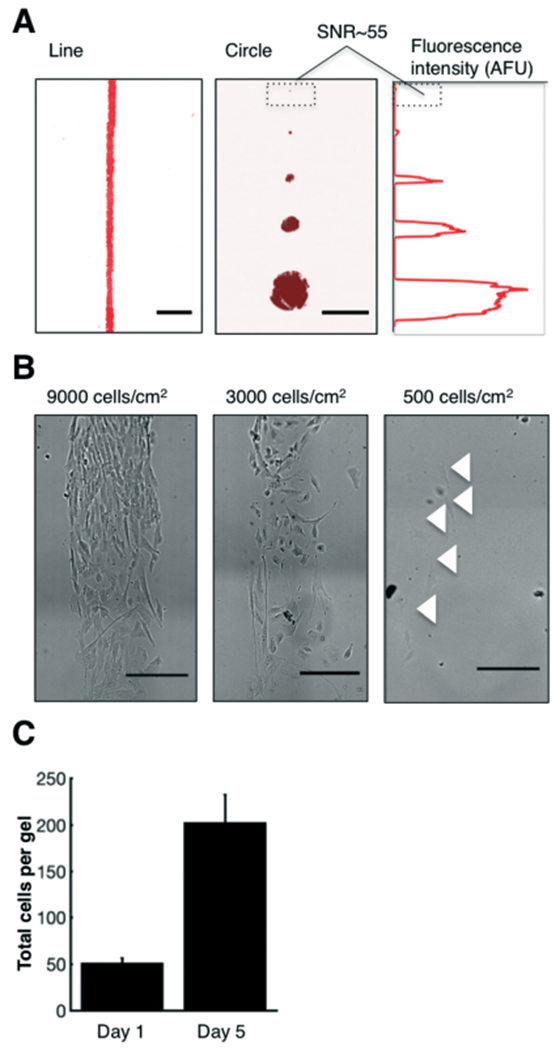
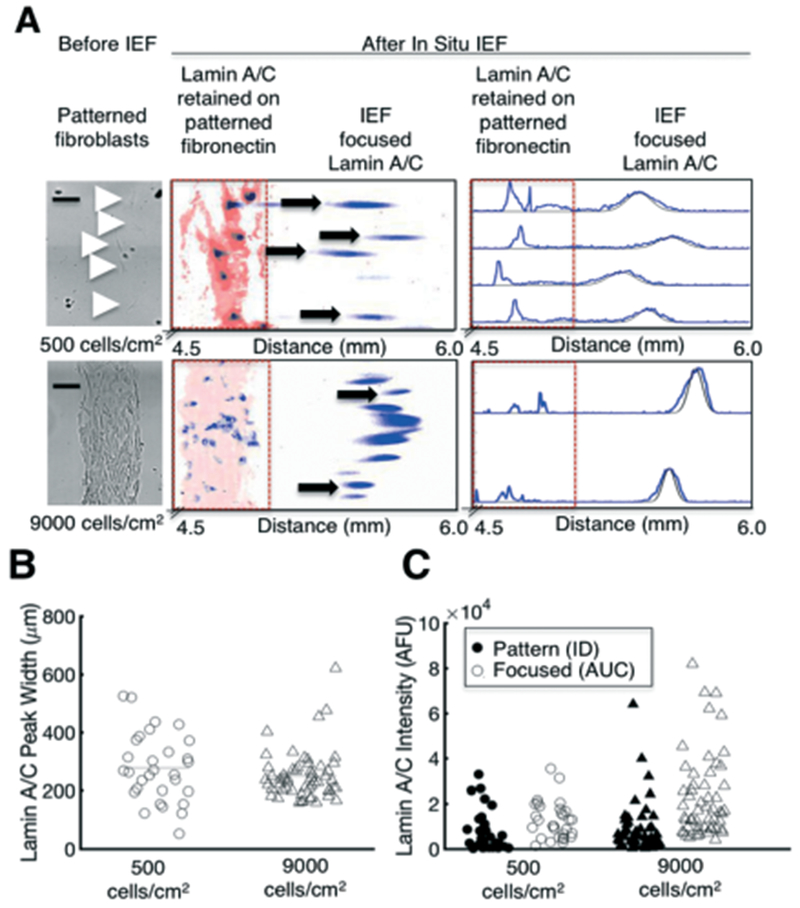
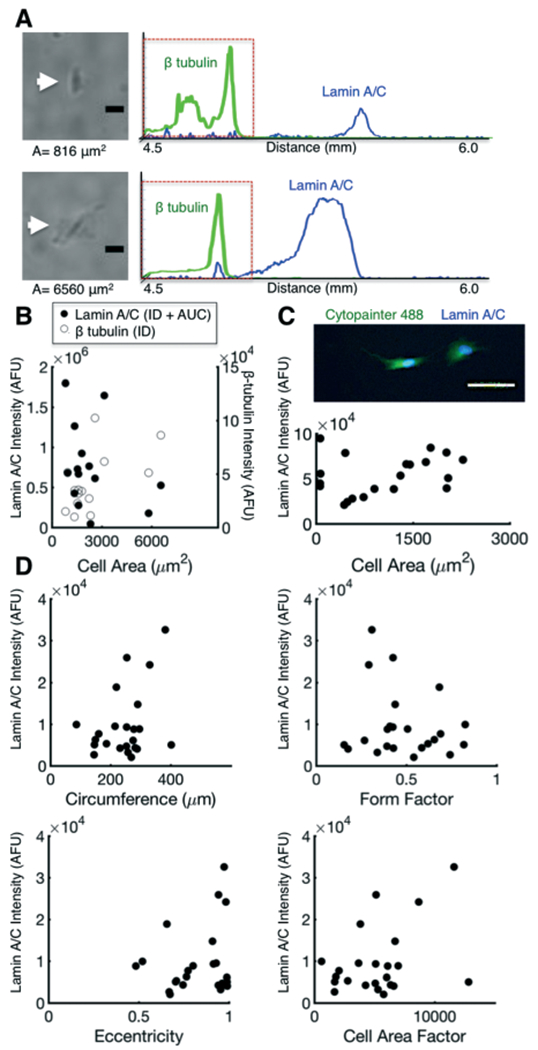
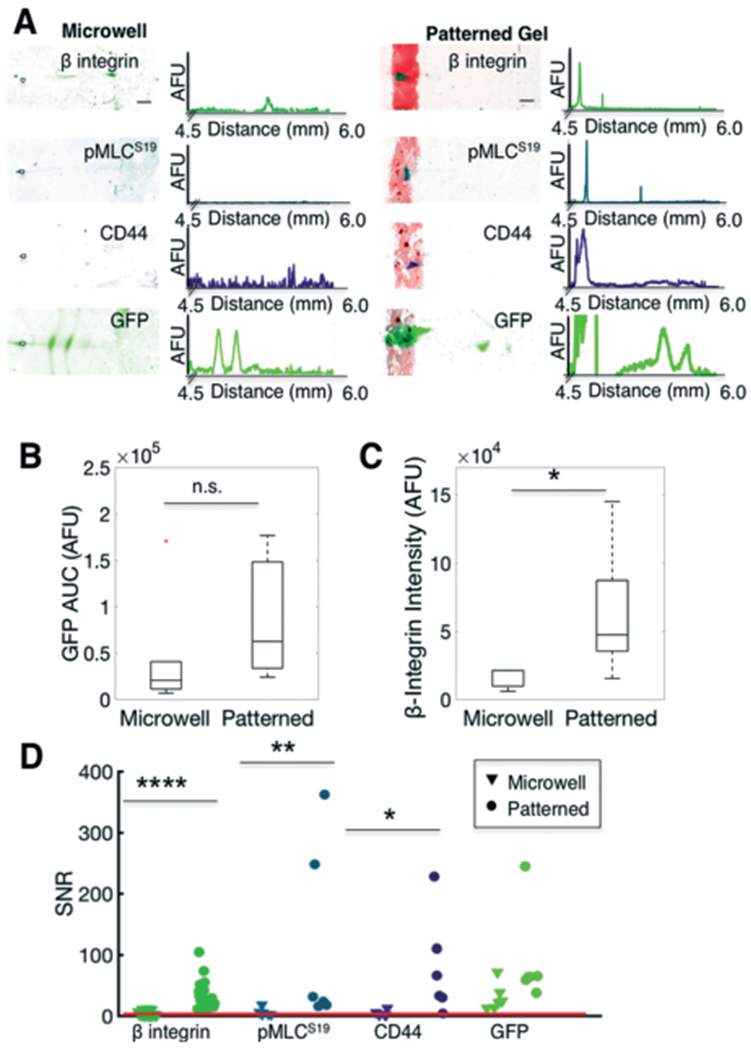
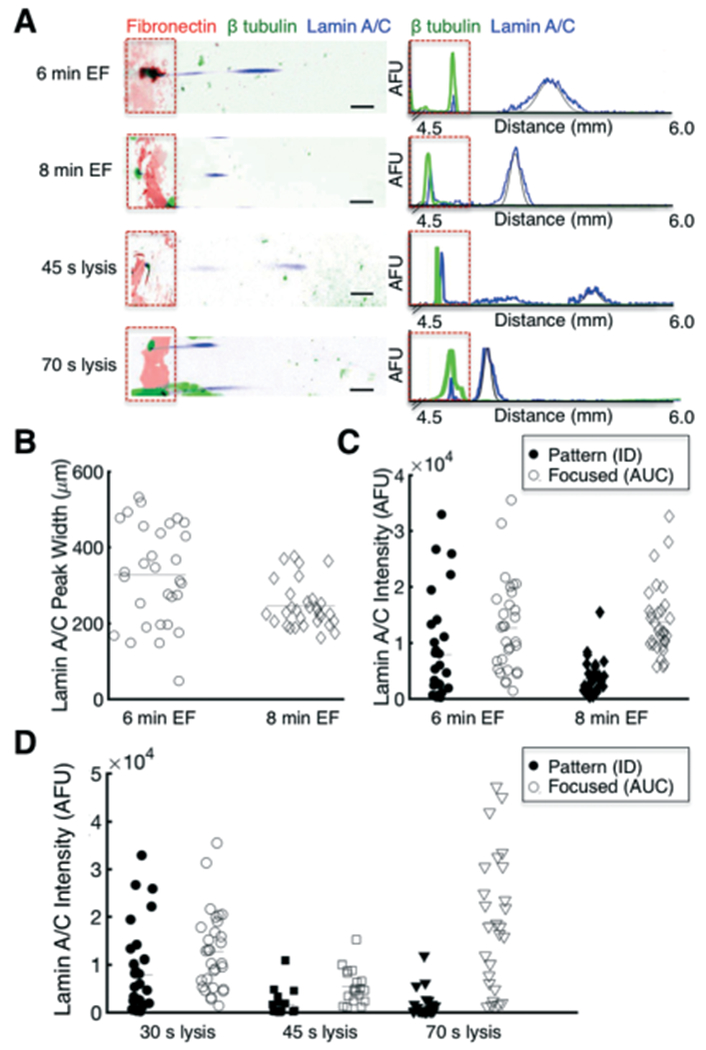
Cell-matrix and cell-cell interactions influence intracellular signalling and play an important role in physiologic and pathologic processes. Detachment of cells from the surrounding microenvironment alters intracellular signalling. Here, we demonstrate and characterise an integrated microfluidic device to culture single and clustered cells in tuneable microenvironments and then directly analyse the lysate of each cell in situ, thereby eliminating the need to detach cells prior to analysis. First, we utilise microcontact printing to pattern cells in confined geometries. We then utilise a microscale isoelectric focusing (IEF) module to separate, detect, and analyse lamin A/C from substrate-adhered cells seeded and cultured at varying (500, 2000, and 9000 cells per cm2) densities. We report separation performance (minimum resolvable pI difference of 0.11) that is on par with capillary IEF and independent of cell density. Moreover, we map lamin A/C and β-tubulin protein expression to morphometric information (cell area, circumference, eccentricity, form factor, and cell area factor) of single cells and observe poor correlation with each of these parameters. By eliminating the need for cell detachment from substrates, we enhance detection of cell receptor proteins (CD44 and β-integrin) and dynamic phosphorylation events (pMLCS19) that are rendered undetectable or disrupted by enzymatic treatments. Finally, we optimise protein solubilisation and separation performance by tuning lysis and electrofocusing (EF) durations. We observe enhanced separation performance (decreased peak width) with longer EF durations by 25.1% and improved protein solubilisation with longer lysis durations. Overall, the combination of morphometric analyses of substrate-adhered cells, with minimised handling, will yield important insights into our understanding of adhesion-mediated signalling processes.
Conflict of interest statement
Conflicts of interest
A E. H. has financial interest in intellectual property related to the device and assay described here and has financial interest in commercialisation.
Figures
Similar articles
-
Surface isoelectric focusing (sIEF) with carrier ampholyte pH gradient.Electrophoresis. 2017 Oct;38(20):2565-2575. doi: 10.1002/elps.201600565. Epub 2017 Aug 21. Electrophoresis. 2017. PMID: 28722147
-
Joule Heating-Induced Dispersion in Open Microfluidic Electrophoretic Cytometry.Anal Chem. 2017 Dec 5;89(23):12787-12796. doi: 10.1021/acs.analchem.7b03096. Epub 2017 Nov 15. Anal Chem. 2017. PMID: 29110464
-
Integration of dialysis membranes into a poly(dimethylsiloxane) microfluidic chip for isoelectric focusing of proteins using whole-channel imaging detection.Anal Chem. 2008 Oct 1;80(19):7401-7. doi: 10.1021/ac8010928. Epub 2008 Aug 29. Anal Chem. 2008. PMID: 18754670
-
IEF in microfluidic devices.Electrophoresis. 2009 Mar;30(5):742-57. doi: 10.1002/elps.200800598. Electrophoresis. 2009. PMID: 19260009 Review.
-
Adhesion based detection, sorting and enrichment of cells in microfluidic Lab-on-Chip devices.Lab Chip. 2010 Nov 21;10(22):3043-53. doi: 10.1039/c0lc00130a. Epub 2010 Sep 29. Lab Chip. 2010. PMID: 20877893 Review.
Cited by
-
Laterally Aggregated Polyacrylamide Gels for Immunoprobed Isoelectric Focusing.Anal Chem. 2020 Feb 18;92(4):3180-3188. doi: 10.1021/acs.analchem.9b04913. Epub 2020 Jan 27. Anal Chem. 2020. PMID: 31985208 Free PMC article.
-
Multi-parametric cell profiling with a CMOS quad-modality cellular interfacing array for label-free fully automated drug screening.Lab Chip. 2018 Sep 26;18(19):3037-3050. doi: 10.1039/c8lc00156a. Lab Chip. 2018. PMID: 30168827 Free PMC article.
-
Protein diffusion from microwells with contrasting hydrogel domains.APL Bioeng. 2019 Apr 19;3(2):026101. doi: 10.1063/1.5078650. eCollection 2019 Jun. APL Bioeng. 2019. PMID: 31069338 Free PMC article.
-
In Situ Single-Cell Western Blot on Adherent Cell Culture.Angew Chem Int Ed Engl. 2019 Sep 23;58(39):13929-13934. doi: 10.1002/anie.201906920. Epub 2019 Aug 21. Angew Chem Int Ed Engl. 2019. PMID: 31390130 Free PMC article. Review.
References
-
- Thul PJ, Åkesson L, Wiking M, Mahdessian D, Geladaki A, Ait Blal H, Alm T, Asplund A, Björk L, Breckels LM, Bäckström A, Danielsson F, Fagerberg L, Fall J, Gatto L, Gnann C, Hober S, Hjelmare M, Johansson F, Lee S, Lindskog C, Mulder J, Mulvey CM, Nilsson P, Oksvold P, Rockberg J, Schutten R, Schwenk JM, Sivertsson Å, Sjöstedt E, Skogs M, Stadler C, Sullivan DP, Tegel H, Winsnes C, Zhang C, Zwahlen M, Mardinoglu A, Pontén F, von Feilitzen K, Lilley KS, Uhlén M and Lundberg E, Science, 2017, 356, eaal3321. - PubMed
-
- Reddig PJ and Juliano RL, Cancer Metastasis Rev., 2005, 24, 425–439. - PubMed
-
- Engler AJ, Sen S, Sweeney HL and Discher DE, Cell, 2006, 126, 677–689. - PubMed
-
- Wang YL and Pelham RJ, Methods Enzymol., 1998, 298, 489–496. - PubMed
-
- Acharya PS, Majumdar S, Jacob M, Hayden J, Mrass P, Weninger W, Assoian RK and Puré E, J. Cell Sci., 2008, 121, 1393–1402. - PubMed
Publication types
MeSH terms
Substances
Grants and funding
LinkOut - more resources
Full Text Sources
Other Literature Sources
Research Materials
Miscellaneous