. 2017 Nov 8;22(5):697-704.e4.
doi: 10.1016/j.chom.2017.10.007.

Segmented Filamentous Bacteria Provoke Lung Autoimmunity by Inducing Gut-Lung Axis Th17 Cells Expressing Dual TCRs

Affiliations

Segmented Filamentous Bacteria Provoke Lung Autoimmunity by Inducing Gut-Lung Axis Th17 Cells Expressing Dual TCRs

C Pierce Bradley et al. Cell Host Microbe. .

Abstract

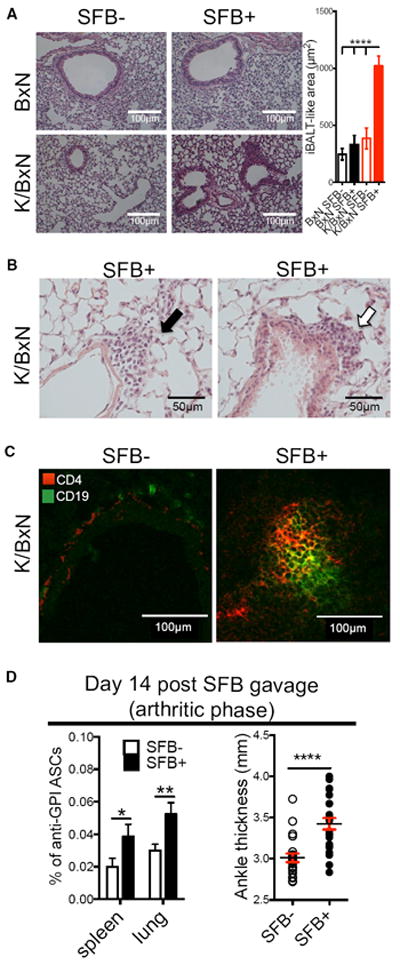
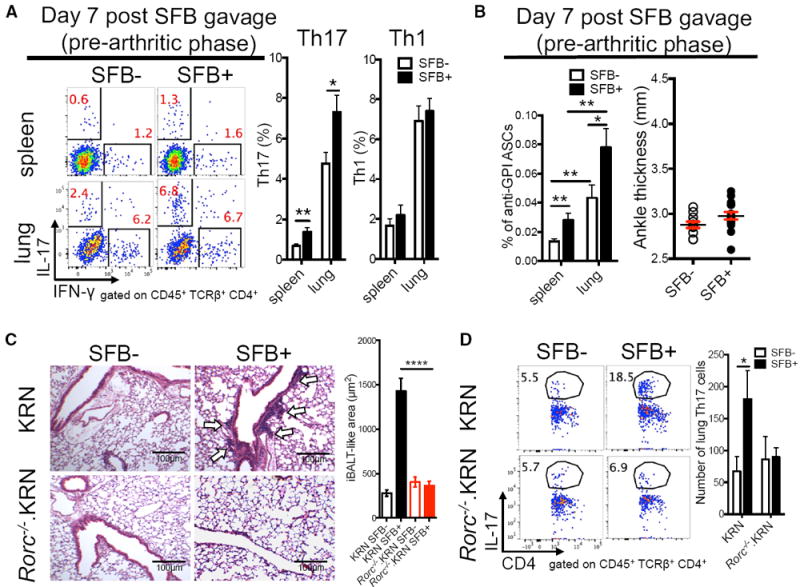
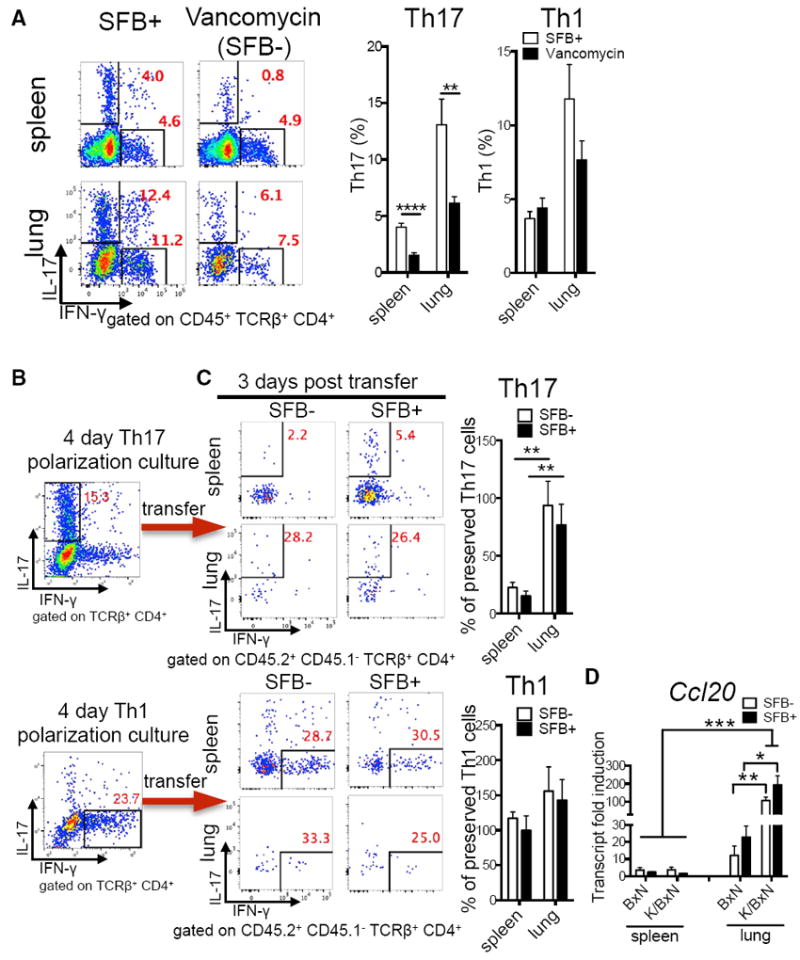
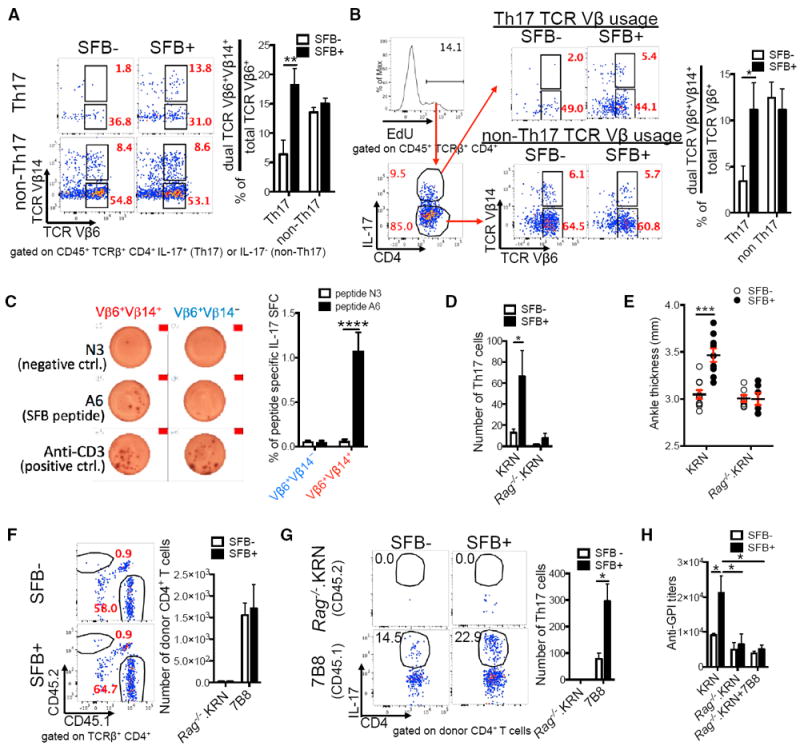
Lung complications are a major cause of rheumatoid arthritis-related mortality. Involvement of gut microbiota in lung diseases by the gut-lung axis has been widely observed, but the underlying mechanism remains mostly unknown. Using an autoimmune arthritis model, we show that a constituent of the gut microbiota, segmented filamentous bacteria (SFB), distantly provoke lung pathology. SFB induce autoantibodies in lung during the pre-arthritic phase, and SFB-dependent lung pathology requires the T helper 17 (Th17) responses. SFB-induced gut Th17 cells are preferentially recruited to lung over spleen due to robust expression in the lung of the Th17 chemoattractant, CCL20. Additionally, we found that in peripheral tissues, SFB selectively expand dual T cell receptor (TCR)-expressing Th17 cells recognizing both an SFB epitope and self-antigen, thus augmenting autoimmunity. This study reveals mechanisms for commensal-mediated gut-lung crosstalk and dual TCR-based autoimmunity.

Keywords: Th17 cells; autoimmune; dual TCR; gut microbiota; gut-lung axis; rheumatoid arthritis.


Figures

Figure 1
Figure 1. SFB Induce iBALT-like Structures and Auto-Abs in the Lung of Arthritic K/BxN Mice
(A) H&E staining of lung from SFB− and SFB+ K/BxN or non-arthritic BxN mice (n = 4/group). (B) Perivascular (black arrow) and peribronchial (open arrow) lung lymphocytic infiltration (n = 4/group). (C) T (CD4+) and B cell (CD19+) zone of lymphocyte aggregation (n = 5–7 mice/group). (D) Anti-GPI ASCs of IgG1 isotype in total K/BxN B cells (Avg + SEM) from day 14 post-SFB gavage. Ankle thickness is also shown. Each symbol indicates average ankle thickness from both ankles of each mouse (n = 19/group, six assays combined).
Figure 2
Figure 2. SFB Induce a Robust Lung Th17 Response Essential for Lung Pathology
(A) Percentage of IL-17+ (Th17) or IFN-γ+ (Th1) cells in CD4+ T cells isolated from SFB− and SFB+ (day 7 post-SFB gavage) K/BxN mice. Quantitative data are also shown as mean + SEM (n = 10/group, four assays combined). (B) Anti-GPI ASCs of IgG1 isotype in total B cells (mean + SEM) from experiments in (A) (n = 10/group, data combined from four assays). Ankle thickness of day-7 post-SFB gavage K/BxN mice is shown (n = 10/group, four assays combined). (C) H&E staining of lung from mice receiving KRN or Rorc−/−.KRN CD4+ T cells (n = 4/group, two assays combined). (D) Percentage of Th17 cells in CD4+ T cells from the experiment in (C). Quantitative data of Th17 cell numbers are also shown as mean + SEM (n = 6–8/group, three assays combined).
Figure 3
Figure 3. SFB Induce Th17 Cells of the Gut-Lung Axis
(A) Percentage of lung and splenic Th17 and Th1 cells from littermates of SFB+ K/BxN mice treated with vancomycin or left untreated (n = 8–9/group, two assays combined). (B) Percentage of Th17 and Th1 cells from Th17- or Th1-polarized KRN T cell cultures before transfer. Representative plots of five assays are shown. (C) The retention of transferred Th17 polarizing cells in recipient spleen or lung from the experiments in (B) is shown and calculated as percentage of preserved Th17 cells: the post-transfer Th17 percentage in spleen or lung were normalized to the starting Th17 percentage in the polarization culture of each of five experiments (n = 5–8/group, five assays combined). Similar calculations were used for Th1 cells. (D) Transcript fold induction of CCL20 (n = 6–10/group, two assays combined).
Figure 4
Figure 4. SFB Trigger Autoimmunity by Expanding Dual TCR-Expressing Autoimmune Th17 Cells
(A) SFB skew dual TCR Vβ6+Vβ14+ usage in lung Th17 cells. Representative plots show TCR Vβ6 versus TCR Vβ14 expression in lung Th17 and non-Th17 cells. Quantitative data showing the percentage of skewed Vβ6+Vβ14+ usage are calculated by dividing the percentage of Vβ6+Vβ14+ Th17 cells by the total Vβ6+ (both Vβ6+Vβ14 and Vβ6+Vβ14+) Th17 cells; similar calculations were applied to non-Th17 cells (n = 10–12/group, four assays combined). (B) SFB increase the percentage of dual TCR Vβ6+Vβ14+ cells (among total TCR Vβ6+ cells) in proliferated (EdU+) lung Th17 but not non-Th17 cells (n = 11–12/group, three assays combined). (C) IL-17A ELISPOT assay of both Vβ6+Vβ14 and Vβ6+Vβ14+ lung CD4+ T cell populations from SFB+ K/BxN mice treated with N3 peptide (negative control), SFB A6 peptide, or anti-CD3 (positive control). Left, representative ELISPOT images. Right, data combined from four experiments; each experiment contained pooled lung T cells from 6–8 mice (2–4 ELISPOT replicate wells/group). (D) Number of Th17 cells in lung of SFB− and SFB+ Tcra−/−.BxN recipients transferred with KRN or Rag−/−.KRN CD4+ T cells (n = 4–9/group, four assays combined). (E) Ankle thickness of SFB− and SFB+ Tcra−/−.BxN recipients transferred with KRN or Rag−/−.KRN CD4+ T cells from experiments in (D) are shown. (F) Rag−/−.KRN and 7B8 CD4+ T cells were mixed at 1:1 ratio and co-transferred into SFB− or SFB+ Tcra−/−.BxN recipients. Representative plots indicate the percentage of Rag−/−.KRN (CD45.2+) and 7B8 (CD45.1+) CD4+ T cells in the total lung CD4+ T cells 4 weeks after transfer. The numbers of CD4+ T cells from both donor types in recipients’ lungs are also shown (n = 4–6/group, four assays combined). (G) Representative plots indicate the percentage of Th17 cells in Rag−/−.KRN and 7B8 lung CD4+ T cells from the experiments in (F). The number of Th17 cells in both Rag−/−.KRN and 7B8 donor cell types are also shown. (H) Serum anti-GPI titers from the experiments in (D) and (F).

Similar articles

Cited by

References

    1. Alam SM, Gascoigne NR. Posttranslational regulation of TCR Valpha allelic exclusion during T cell differentiation. J Immunol. 1998;160:3883–3890. - PubMed
    1. Albert LJ, Inman RD. Molecular mimicry and autoimmunity. N Engl J Med. 1999;341:2068–2074. - PubMed
    1. Anderson KG, Sung H, Skon CN, Lefrancois L, Deisinger A, Vezys V, Masopust D. Cutting edge: intravascular staining redefines lung CD8 T cell responses. J Immunol. 2012;189:2702–2706. - PMC - PubMed
    1. Auger JL, Haasken S, Steinert EM, Binstadt BA. Incomplete TCR-β allelic exclusion accelerates spontaneous autoimmune arthritis in K/BxN TCR transgenic mice. Eur J Immunol. 2012;42:2354–2362. - PMC - PubMed
    1. Budden KF, Gellatly SL, Wood DL, Cooper MA, Morrison M, Hugenholtz P, Hansbro PM. Emerging pathogenic links between microbiota and the gut-lung axis. Nat Rev Microbiol. 2017;15:55–63. - PubMed

Publication types

MeSH terms