

Systematic Review of Salivary Versus Blood Concentrations of Antituberculosis Drugs and Their Potential for Salivary Therapeutic Drug Monitoring
- PMID: 29120971
- PMCID: PMC6345279
- DOI: 10.1097/FTD.0000000000000462
Systematic Review of Salivary Versus Blood Concentrations of Antituberculosis Drugs and Their Potential for Salivary Therapeutic Drug Monitoring
Abstract
Background: Therapeutic drug monitoring is useful in the treatment of tuberculosis to assure adequate exposure, minimize antibiotic resistance, and reduce toxicity. Salivary therapeutic drug monitoring could reduce the risks, burden, and costs of blood-based therapeutic drug monitoring. This systematic review compared human pharmacokinetics of antituberculosis drugs in saliva and blood to determine if salivary therapeutic drug monitoring could be a promising alternative.
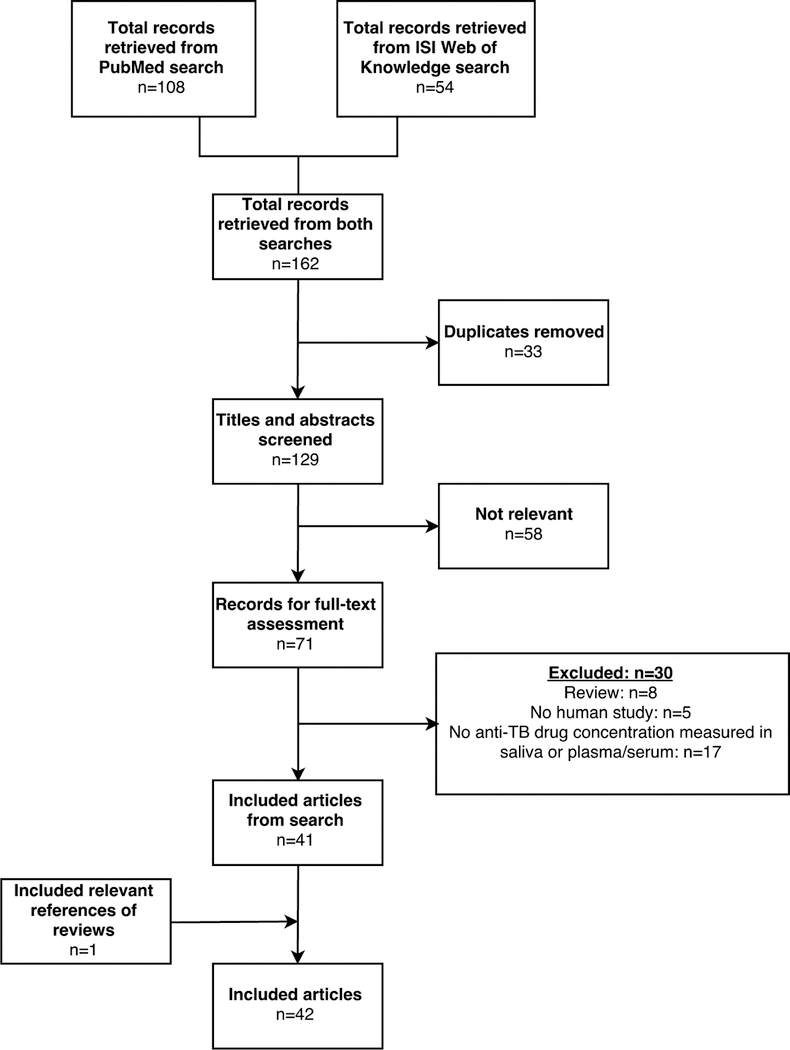
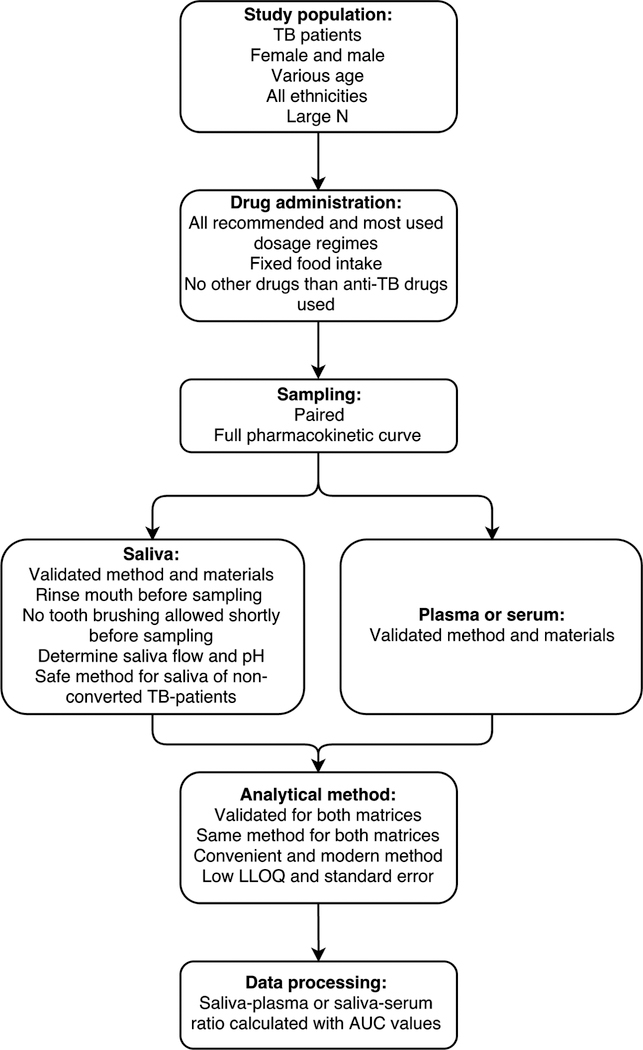
Methods: On December 2, 2016, PubMed and the Institute for Scientific Information Web of Knowledge were searched for pharmacokinetic studies reporting human salivary and blood concentrations of antituberculosis drugs. Data on study population, study design, analytical method, salivary Cmax, salivary area under the time-concentration curve, plasma/serum Cmax, plasma/serum area under the time-concentration curve, and saliva-plasma or saliva-serum ratio were extracted. All included articles were assessed for risk of bias.
Results: In total, 42 studies were included in this systematic review. For the majority of antituberculosis drugs, including the first-line drugs ethambutol and pyrazinamide, no pharmacokinetic studies in saliva were found. For amikacin, pharmacokinetic studies without saliva-plasma or saliva-serum ratios were found.
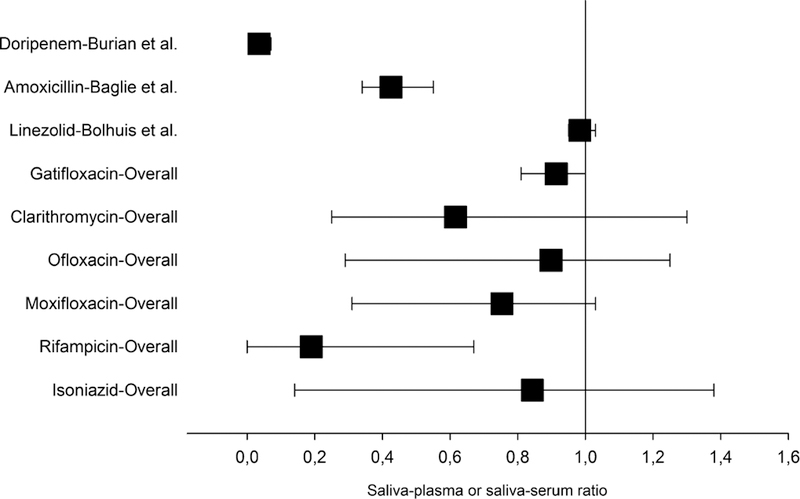
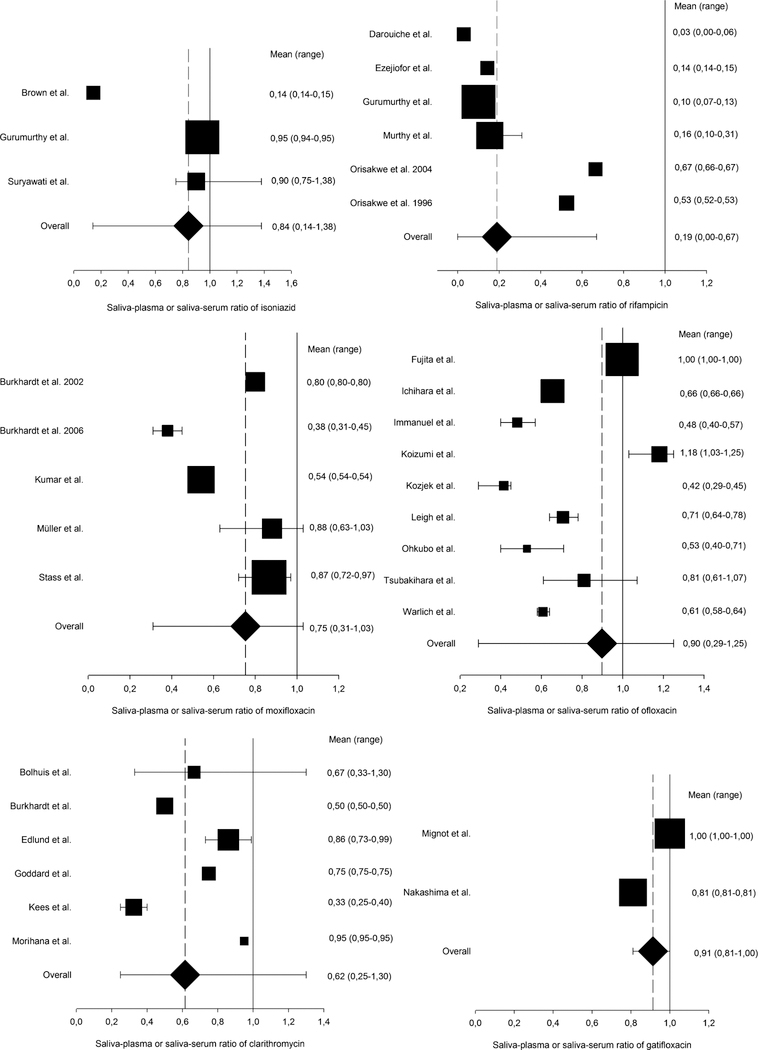
Conclusions: For gatifloxacin and linezolid, salivary therapeutic drug monitoring is likely possible due to a narrow range of saliva-plasma and saliva-serum ratios. For isoniazid, rifampicin, moxifloxacin, ofloxacin, and clarithromycin, salivary therapeutic drug monitoring might be possible; however, a large variability in saliva-plasma and saliva-serum ratios was observed. Unfortunately, salivary therapeutic drug monitoring is probably not possible for doripenem and amoxicillin/clavulanate, as a result of very low salivary drug concentrations.
Conflict of interest statement
The authors declare no conflict of interest.
Figures
References
-
- World Health Organization. Global Tuberculosis Report 2016 Geneva, Switzerland: WHO Press; 2016.
-
- World Health Organization. Treatment of Tuberculosis Guidelines 4th ed. Geneva, Switzerland: WHO Press; 2010.
-
- World Health Organization. Treatment Guidelines of Drug-Resistant Tuberculosis Geneva, Switzerland: WHO Press; 2016.
-
- Zuur MA, Bolhuis MS, Anthony R, et al. Current status and opportunities for therapeutic drug monitoring in the treatment of tuberculosis. Expert Opin Drug Metab Toxicol 2016;12:509–521. - PubMed
-
- Weiner M, Benator D, Burman W, et al. Association between acquired rifamycin resistance and the pharmacokinetics of rifabutin and isoniazid among patients with HIV and tuberculosis. Clin Infect Dis 2005;40: 1481–1491. - PubMed
Publication types
MeSH terms
Substances
Grants and funding
LinkOut - more resources
Full Text Sources
Other Literature Sources
