. 2017 Nov 9;12(11):e0176181.
doi: 10.1371/journal.pone.0176181. eCollection 2017.

Loss of function JAK1 mutations occur at high frequency in cancers with microsatellite instability and are suggestive of immune evasion

Affiliations

Loss of function JAK1 mutations occur at high frequency in cancers with microsatellite instability and are suggestive of immune evasion

Lee A Albacker et al. PLoS One. .

Abstract

Immune evasion is a well-recognized hallmark of cancer and recent studies with immunotherapy agents have suggested that tumors with increased numbers of neoantigens elicit greater immune responses. We hypothesized that the immune system presents a common selective pressure on high mutation burden tumors and therefore immune evasion mutations would be enriched in high mutation burden tumors. The JAK family of kinases is required for the signaling of a host of immune modulators in tumor, stromal, and immune cells. Therefore, we analyzed alterations in this family for the hypothesized signature of an immune evasion mutation. Here, we searched a database of 61,704 unique solid tumors for alterations in the JAK family kinases (JAK1/2/3, TYK2). We used The Cancer Genome Atlas and Cancer Cell Line Encyclopedia data to confirm and extend our findings by analyzing gene expression patterns. Recurrent frameshift mutations in JAK1 were associated with high mutation burden and microsatellite instability. These mutations occurred in multiple tumor types including endometrial, colorectal, stomach, and prostate carcinomas. Analyzing gene expression signatures in endometrial and stomach adenocarcinomas revealed that tumors with a JAK1 frameshift exhibited reduced expression of interferon response signatures and multiple anti-tumor immune signatures. Importantly, endometrial cancer cell lines exhibited similar gene expression changes that were expected to be tumor cell intrinsic (e.g. interferon response) but not those expected to be tumor cell extrinsic (e.g. NK cells). From these data, we derive two primary conclusions: 1) JAK1 frameshifts are loss of function alterations that represent a potential pan-cancer adaptation to immune responses against tumors with microsatellite instability; 2) The mechanism by which JAK1 loss of function contributes to tumor immune evasion is likely associated with loss of the JAK1-mediated interferon response.


Conflict of interest statement

Competing Interests: All authors are employees of and equity holders in either Foundation Medicine (LAA, PJS, JC) or H3 Biomedicine (JW, PS, MW, PZ, LY). This does not alter our adherence to PLOS ONE policies on sharing data and materials.

Figures

Fig 1
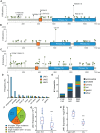
Fig 1. Recurrent JAK frameshift alterations in solid tumors.
(A-C) Incidence of mutations by amino acid (only positions with >2 tumors mutated shown) in (A) JAK1, (B) JAK2, and (C) JAK3. (D) The frequency of JAK1/2/3 frameshift mutations in different tumor types, scc other = squamous cell carcinoma of the eye, penis, trachea, vagina, vulva, or unknown primary. (E) Number of JAK1 frameshifts observed in the three most common hotspots by disease type. (F) Pie chart classifying JAK1 alterations by the number of JAK1 copies mutated. (G, H) Box and whiskers plots of JAK1 expression in endometrial (G) tumors from TCGA, expression measure is scaled estimate and (H) CCLE cell lines, expression measure is log2 of transcripts per million (TPM). The red line defines the median, box defines the quartiles and the whiskers define the 10th and 90th percentiles. The notch in the box provides a 95% confidence interval around the median. (*** = P < 10−4, Mann-Whitney U test).
Fig 2
Fig 2. Association of JAK1 frameshifts with MSI and high tumor mutational burden.
(A) Frequency of JAK1 frameshifts by tumor type stratified by MSS/MSI-H status. Error bars show standard error. (*** = P < 10−4, Fisher’s exact test) (B-E) Box and whiskers plots of mutations per Mb in (B) endometrial, (C) prostate, (D) CRC, and (E) gastric cancers. The red line defines the median, box defines the quartiles and the whiskers define the 10th and 90th percentiles. The notch in the box provides a 95% confidence interval around the median (*** = P < 10−4, Mann-Whitney U test). (F) Frequency of JAK1 frameshifts by tumor type stratified by MSS/MSI-L/MSI-H status (*** = P < 10−4, * = P < 0.05, Fisher’s exact test). (G) Frequency of JAK1 frameshifts in MSI-H tumors from the FMI and TCGA cohorts (* = P < 0.05, Fisher’s exact test). (H-J) Box and whiskers plots of coding mutations per exome in (H) endometrial, (I) stomach, and (J) colon adenocarcinomas (* = P < 0.05, *** = P < 10−4, Mann-Whitney U test).
Fig 3
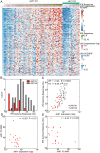
Fig 3. Sample level gene expression changes in MSI-H UCEC samples with a JAK1 frameshift.
(A) Heatmap of MSI-H, UCEC tumors (columns). Marker rows: 1) Samples with a JAK1 frameshift are denoted in green. 2) IFN Response, after JAK1 frameshift samples are ordered by IFN Response. 3) Log10 of JAK1 expression. 4) JAK1 frameshift (FS) MAF. Gene expression was scaled by Z scoring and the order of genes (rows) is determined by the signal to noise metric for GSEA analysis (t). Negative t indicated decreased expression in JAK1 frameshift samples. Only genes in the HALLMARK IFN GAMMA RESPONSE are shown. (B) Histogram of IFN Gamma Response in arbitrary units (AU). (C) Scatter plot of samples for JAK1 expression and IFN Gamma Response. Pearson’s r and associated P values are shown. (D) Scatter plot of samples for JAK1 expression and JAK1 FS MAF. Pearson’s r and associated P values are shown. (E) Scatter plot of JAK1 frameshift samples for JAK1 FS MAF and IFN Gamma Response. Pearson’s r and associated P value is shown.
Fig 4
Fig 4. GSEA results in UCEC and CCLE.
Heatmap showing the maximum enrichment score (ES) for (A) Hallmark or (B) Immune gene sets in UCEC and CCLE for significantly altered gene sets. Negative ES indicates expression is decreased in JAK1 frameshift samples. White star indicates gene set is significantly altered in that disease type (FWER P < 0.05).
Fig 5
Fig 5. Sample level gene expression changes in MSI-H STAD samples with a JAK1 frameshift.
(A) Heatmap of MSI-H, STAD tumors (columns). Marker rows: 1) Samples with a JAK1 frameshift are denoted in green. 2) IFN Response, after JAK1 frameshift samples are ordered by IFN Response. 3) Log10 of JAK1 expression. 4) JAK1 frameshift (FS) MAF. Gene expression was scaled by Z scoring and the order of genes (rows) is determined by the signal to noise metric for GSEA analysis (t). Negative t indicated decreased expression in JAK1 frameshift samples. Only genes in the HALLMARK IFN GAMMA RESPONSE are shown. (B) Histogram of IFN Gamma Response in arbitrary units (AU). (C) Scatter plot of samples for JAK1 expression and IFN Gamma Response. Pearson’s r and associated P values are shown. (D) Scatter plot of samples for JAK1 expression and JAK1 FS MAF. Pearson’s r and associated P values are shown. (E) Scatter plot of JAK1 frameshift samples for JAK1 FS MAF and IFN Gamma Response. Pearson’s r and associated P value is shown.
Fig 6
Fig 6. Comparison of GSEA results for UCEC and STAD.
Heatmap showing the maximum enrichment score (ES) for (A) Hallmark or (B) Immune gene sets in UCEC and STAD for significantly altered gene sets. Negative ES indicates expression is decreased in JAK1 frameshift samples. White star indicates gene set is significantly altered in that disease type (FWER P < 0.05).

Similar articles

Cited by

References

    1. Hanahan D, Weinberg RA. Hallmarks of cancer: the next generation. Cell. 2011;144(5):646–74. doi: 10.1016/j.cell.2011.02.013 - DOI - PubMed
    1. Dunn GP, Bruce AT, Ikeda H, Old LJ, Schreiber RD. Cancer immunoediting: from immunosurveillance to tumor escape. Nat Immunol. 2002;3(11):991–8. doi: 10.1038/ni1102-991 - DOI - PubMed
    1. Jass JR. Lymphocytic infiltration and survival in rectal cancer. J Clin Pathol. 1986;39(6):585–9. - PMC - PubMed
    1. Clemente CG, Mihm MC Jr., Bufalino R, Zurrida S, Collini P, Cascinelli N. Prognostic value of tumor infiltrating lymphocytes in the vertical growth phase of primary cutaneous melanoma. Cancer. 1996;77(7):1303–10. doi: 10.1002/(SICI)1097-0142(19960401)77:7<1303::AID-CNCR12>3.0.CO;2-5 - DOI - PubMed
    1. Zhang L, Conejo-Garcia JR, Katsaros D, Gimotty PA, Massobrio M, Regnani G, et al. Intratumoral T cells, recurrence, and survival in epithelial ovarian cancer. N Engl J Med. 2003;348(3):203–13. doi: 10.1056/NEJMoa020177 - DOI - PubMed