

Proteome profiling in the aorta and kidney of type 1 diabetic rats
- PMID: 29121074
- PMCID: PMC5679573
- DOI: 10.1371/journal.pone.0187752
Proteome profiling in the aorta and kidney of type 1 diabetic rats
Abstract
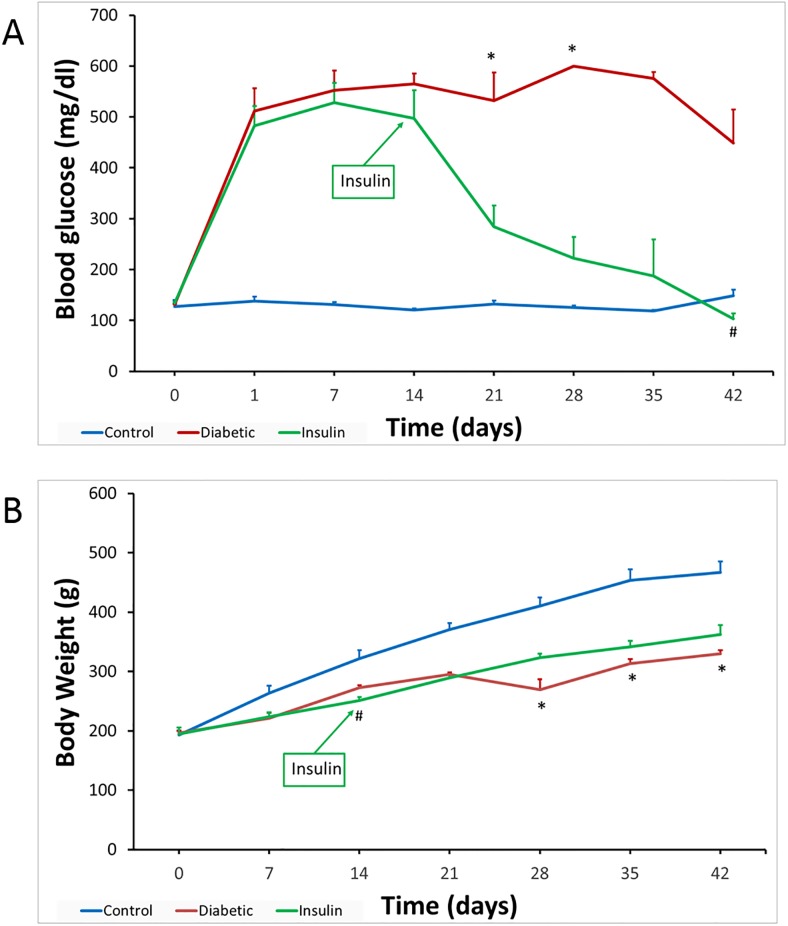
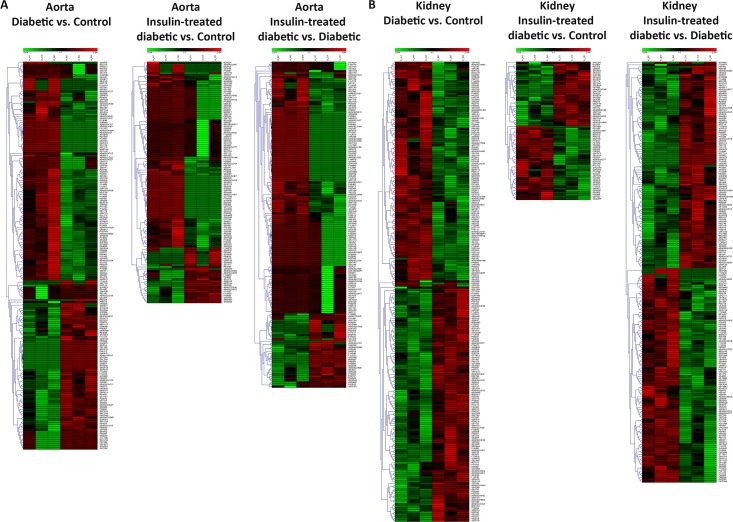
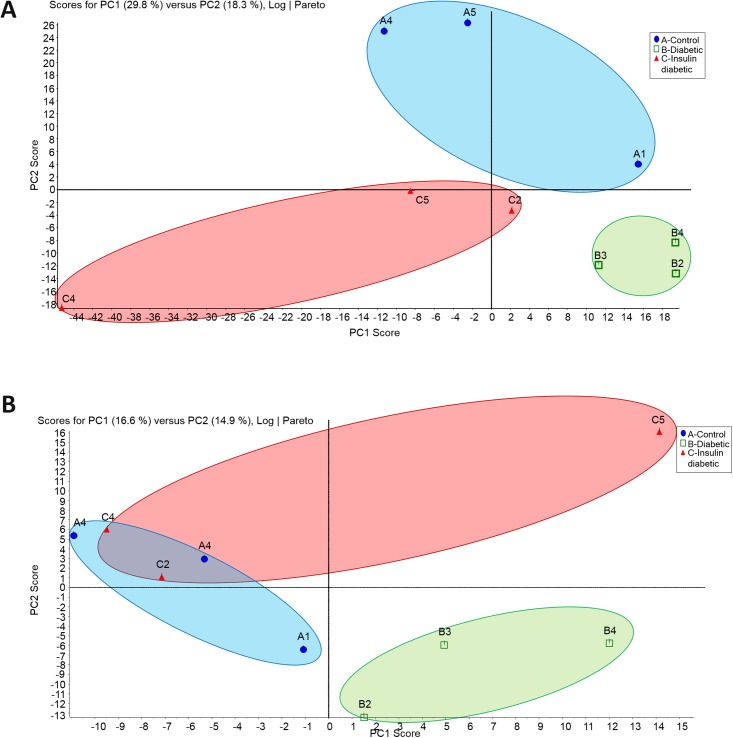
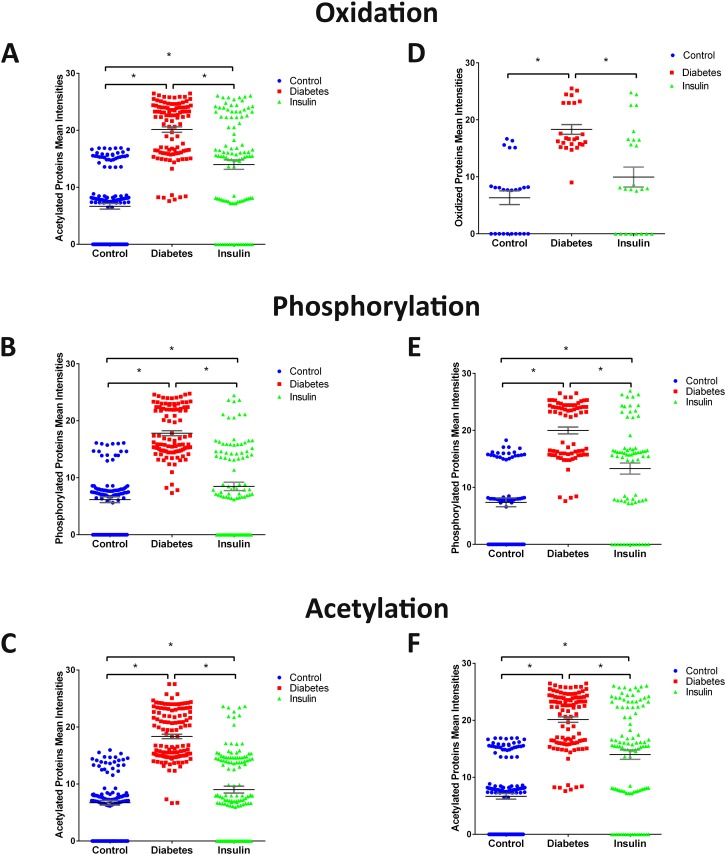
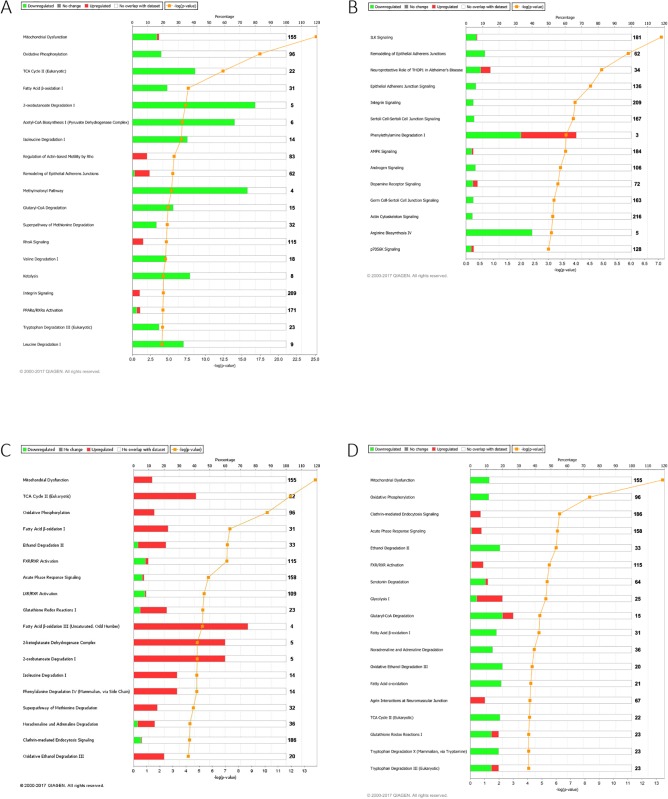
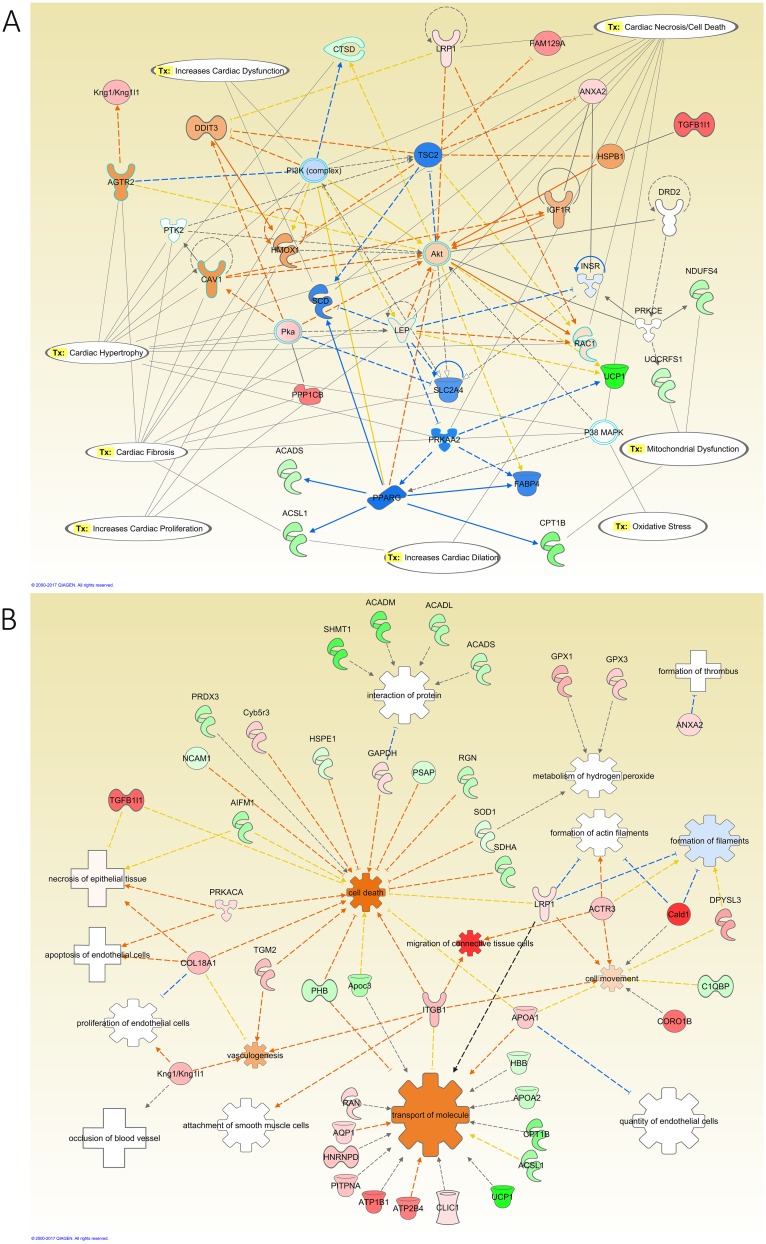
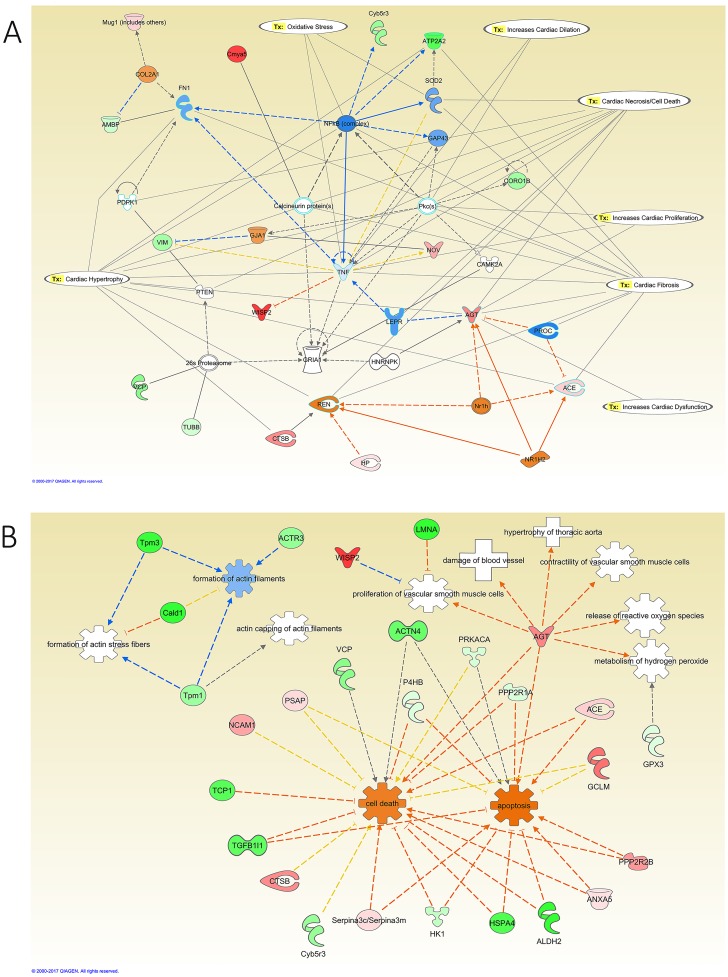
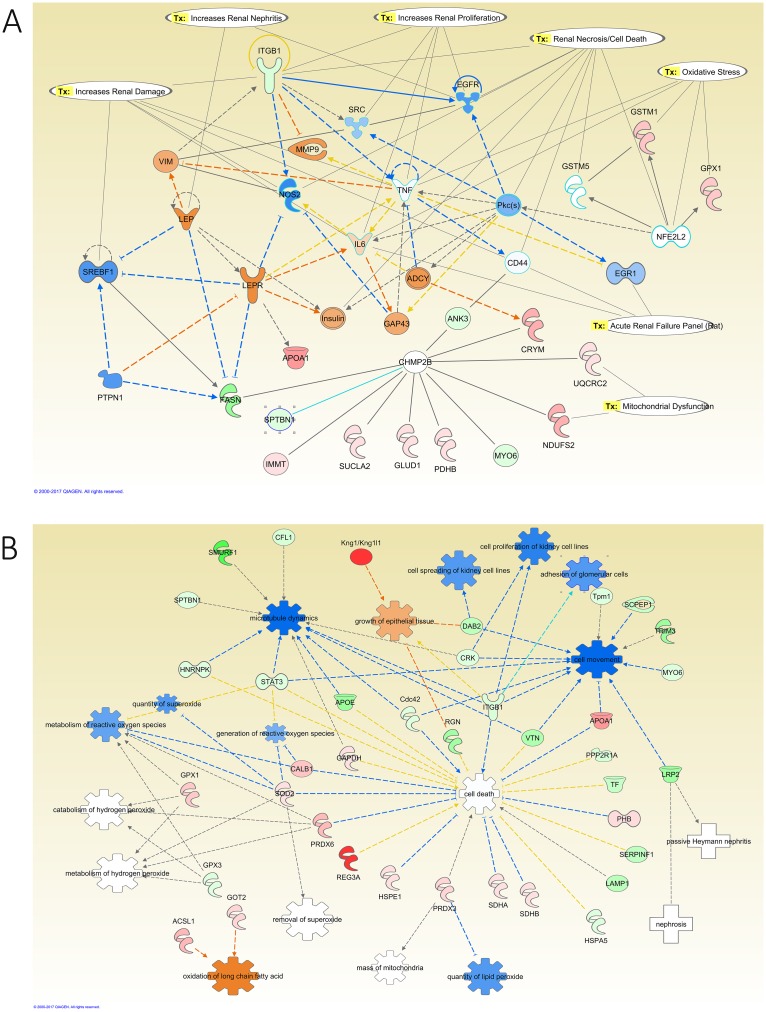
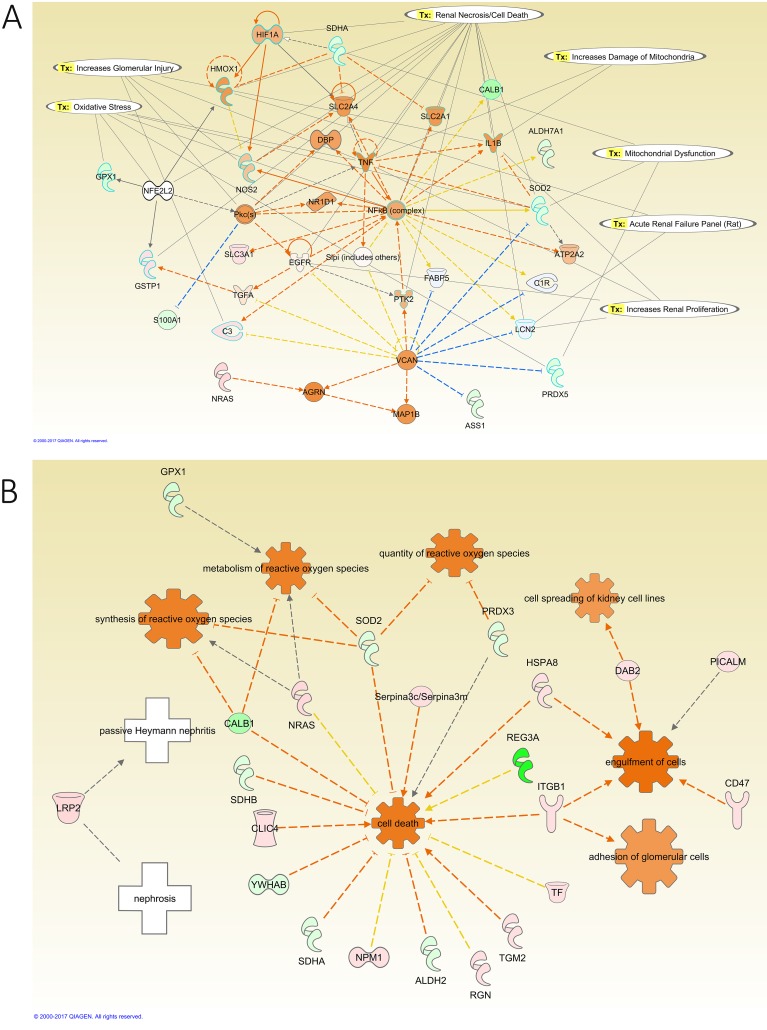
Diabetes is associated with a number of metabolic and cardiovascular risk factors that contribute to a high rate of microvascular and macrovascular complications. The risk factors and mechanisms that contribute to the development of micro- and macrovascular disease in diabetes are not fully explained. In this study, we employed mass spectrometric analysis using tandem LC-MS/MS to generate a proteomic profile of protein abundance and post-translational modifications (PTM) in the aorta and kidney of diabetic rats. In addition, systems biology analyses were employed to identify key protein markers that can provide insights into molecular pathways and processes that are differentially regulated in the aorta and kidney of type 1 diabetic rats. Our results indicated that 188 (111 downregulated and 77 upregulated) proteins were significantly identified in the aorta of diabetic rats compared to normal controls. A total of 223 (109 downregulated and 114 upregulated) proteins were significantly identified in the kidney of diabetic rats compared to normal controls. When the protein profiles from the kidney and aorta of diabetic and control rats were analyzed by principal component analysis, a distinct separation of the groups was observed. In addition, diabetes resulted in a significant increase in PTM (oxidation, phosphorylation, and acetylation) of proteins in the kidney and aorta and this effect was partially reversed by insulin treatment. Ingenuity pathway analysis performed on the list of differentially expressed proteins depicted mitochondrial dysfunction, oxidative phosphorylation and acute phase response signaling to be among the altered canonical pathways by diabetes in both tissues. The findings of the present study provide a global proteomics view of markers that highlight the mechanisms and putative processes that modulate renal and vascular injury in diabetes.
Conflict of interest statement
Figures
Similar articles
-
Comparison of the effects of levocetirizine and losartan on diabetic nephropathy and vascular dysfunction in streptozotocin-induced diabetic rats.Eur J Pharmacol. 2016 Jun 5;780:82-92. doi: 10.1016/j.ejphar.2016.03.035. Epub 2016 Mar 21. Eur J Pharmacol. 2016. PMID: 27012991
-
Differential expression of proteins in kidney, eye, aorta, and serum of diabetic and non-diabetic rats.J Cell Biochem. 2006 Sep 1;99(1):256-68. doi: 10.1002/jcb.20923. J Cell Biochem. 2006. PMID: 16598775
-
Changes in caveolin-1 expression and vasoreactivity in the aorta and corpus cavernosum of fructose and streptozotocin-induced diabetic rats.Eur J Pharmacol. 2010 Sep 10;642(1-3):113-20. doi: 10.1016/j.ejphar.2010.05.049. Epub 2010 Jun 8. Eur J Pharmacol. 2010. PMID: 20553910
-
[New exploration of treatment target for proliferative diabetic retinopathy based on iTRAQ LC-MS/MS Proteomics].Zhonghua Yan Ke Za Zhi. 2019 Oct 11;55(10):769-776. doi: 10.3760/cma.j.issn.0412-4081.2019.10.008. Zhonghua Yan Ke Za Zhi. 2019. PMID: 31607066 Chinese.
-
Anti-atherosclerotic and renoprotective effects of combined angiotensin-converting enzyme and neutral endopeptidase inhibition in diabetic apolipoprotein E-knockout mice.J Hypertens. 2005 Nov;23(11):2071-82. doi: 10.1097/01.hjh.0000184747.41565.a1. J Hypertens. 2005. PMID: 16208151
Cited by
-
Maternal serum proteomic profiles of pregnant women with type 1 diabetes.Sci Rep. 2022 May 24;12(1):8696. doi: 10.1038/s41598-022-12221-5. Sci Rep. 2022. PMID: 35610262 Free PMC article.
-
Quantifying Protein Acetylation in Diabetic Nephropathy from Formalin-Fixed Paraffin-Embedded Tissue.Proteomics Clin Appl. 2024 Nov;18(6):e202400018. doi: 10.1002/prca.202400018. Epub 2024 Jun 24. Proteomics Clin Appl. 2024. PMID: 38923810
-
Comparative Transcriptomics and Proteomics of Cancer Cell Lines Cultivated by Physiological and Commercial Media.Biomolecules. 2022 Oct 27;12(11):1575. doi: 10.3390/biom12111575. Biomolecules. 2022. PMID: 36358924 Free PMC article.
-
Investigation of proteins important for microcirculation using in vivo microdialysis after glucose provocation: a proteomic study.Sci Rep. 2021 Sep 27;11(1):19093. doi: 10.1038/s41598-021-98672-8. Sci Rep. 2021. PMID: 34580391 Free PMC article.
-
Mechanism of how carbamylation reduces albumin binding to FcRn contributing to increased vascular clearance.Am J Physiol Renal Physiol. 2021 Jan 1;320(1):F114-F129. doi: 10.1152/ajprenal.00428.2020. Epub 2020 Dec 7. Am J Physiol Renal Physiol. 2021. PMID: 33283642 Free PMC article.
References
-
- Cho NH (2016) Q&A: Five questions on the 2015 IDF Diabetes Atlas. Diabetes Res Clin Pract 115: 157–159. doi: 10.1016/j.diabres.2016.04.048 - DOI - PubMed
-
- da Rocha Fernandes J, Ogurtsova K, Linnenkamp U, Guariguata L, Seuring T, Zhang P, et al. (2016) IDF Diabetes Atlas estimates of 2014 global health expenditures on diabetes. Diabetes Res Clin Pract 117: 48–54. doi: 10.1016/j.diabres.2016.04.016 - DOI - PubMed
-
- Ding Y, Sun X, Shan PF (2017) MicroRNAs and Cardiovascular Disease in Diabetes Mellitus. Biomed Res Int 2017: 4080364 doi: 10.1155/2017/4080364 - DOI - PMC - PubMed
-
- Bannier K, Lichtenauer M, Franz M, Fritzenwanger M, Kabisch B, Figulla HR, et al. (2015) Impact of diabetes mellitus and its complications: survival and quality-of-life in critically ill patients. J Diabetes Complications 29: 1130–1135. doi: 10.1016/j.jdiacomp.2015.08.010 - DOI - PubMed
-
- Mogensen CE (1997) How to protect the kidney in diabetic patients: with special reference to IDDM. Diabetes 46 Suppl 2: S104–111. - PubMed
MeSH terms
Substances
Grants and funding
LinkOut - more resources
Full Text Sources
Other Literature Sources
Medical
