. 2017 Nov 9;12(11):e0187775.
doi: 10.1371/journal.pone.0187775. eCollection 2017.

Fission yeast strains with circular chromosomes require the 9-1-1 checkpoint complex for the viability in response to the anti-cancer drug 5-fluorodeoxyuridine

Affiliations

Fission yeast strains with circular chromosomes require the 9-1-1 checkpoint complex for the viability in response to the anti-cancer drug 5-fluorodeoxyuridine

Hossain Mohammad Shamim et al. PLoS One. .

Abstract

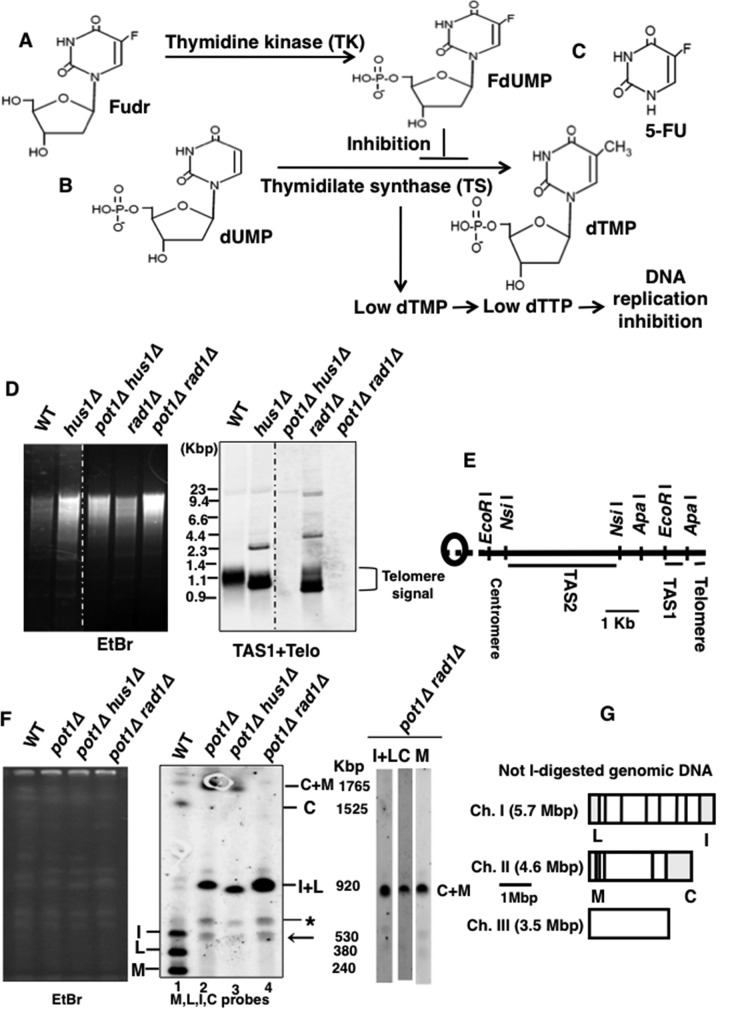
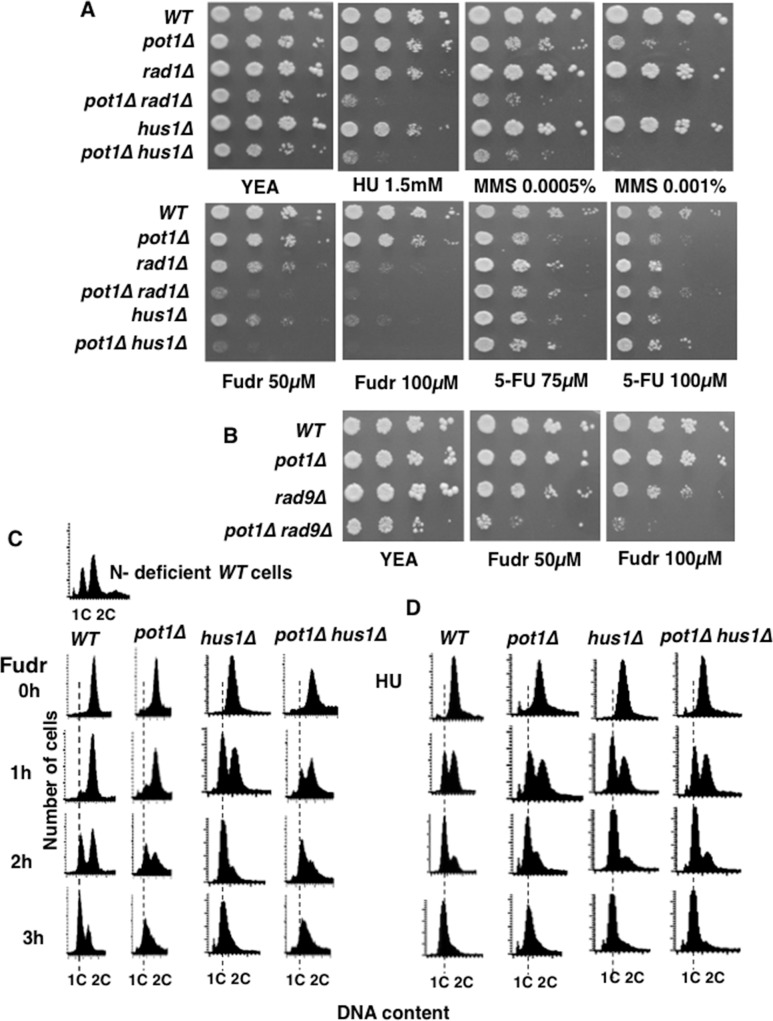
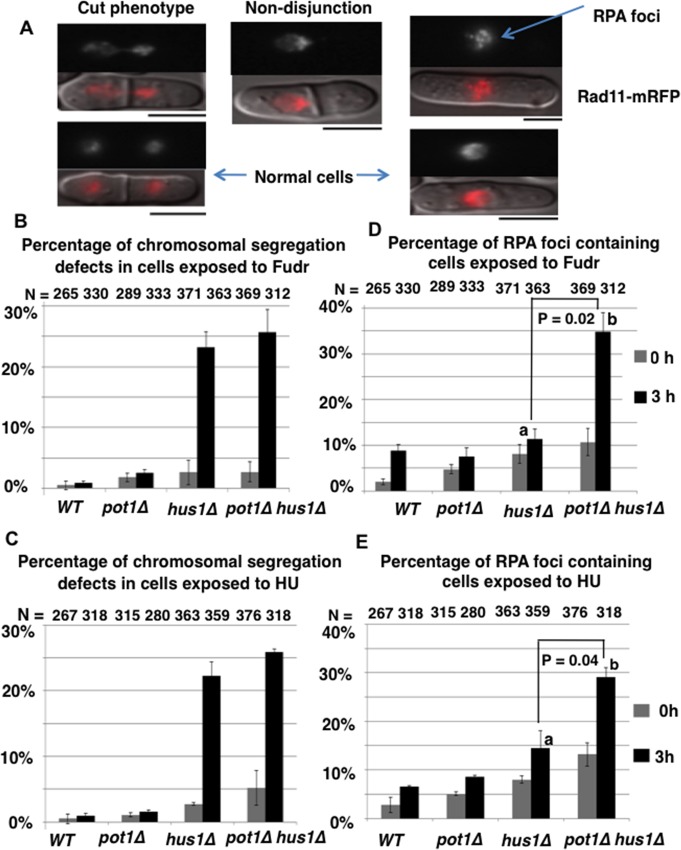
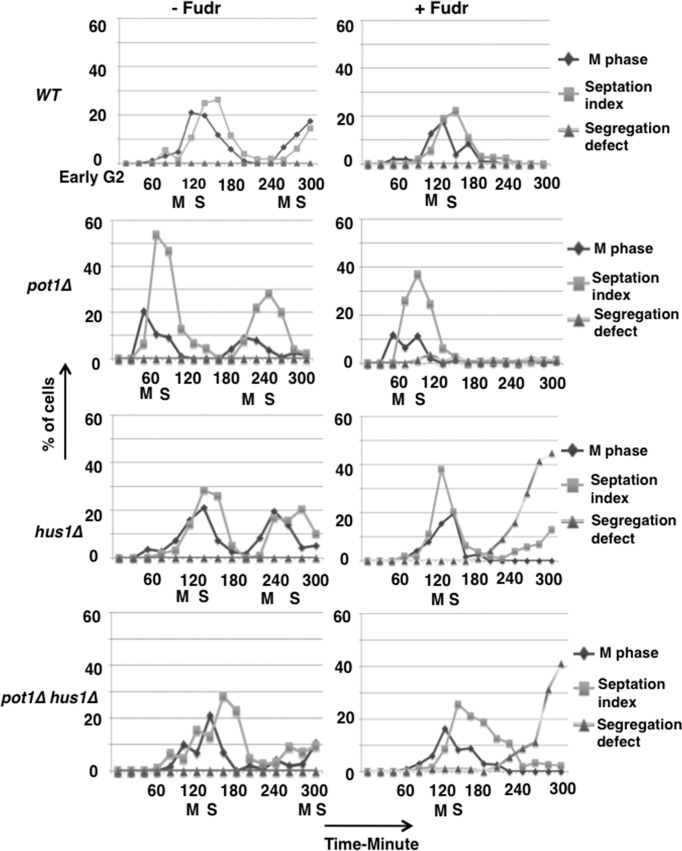
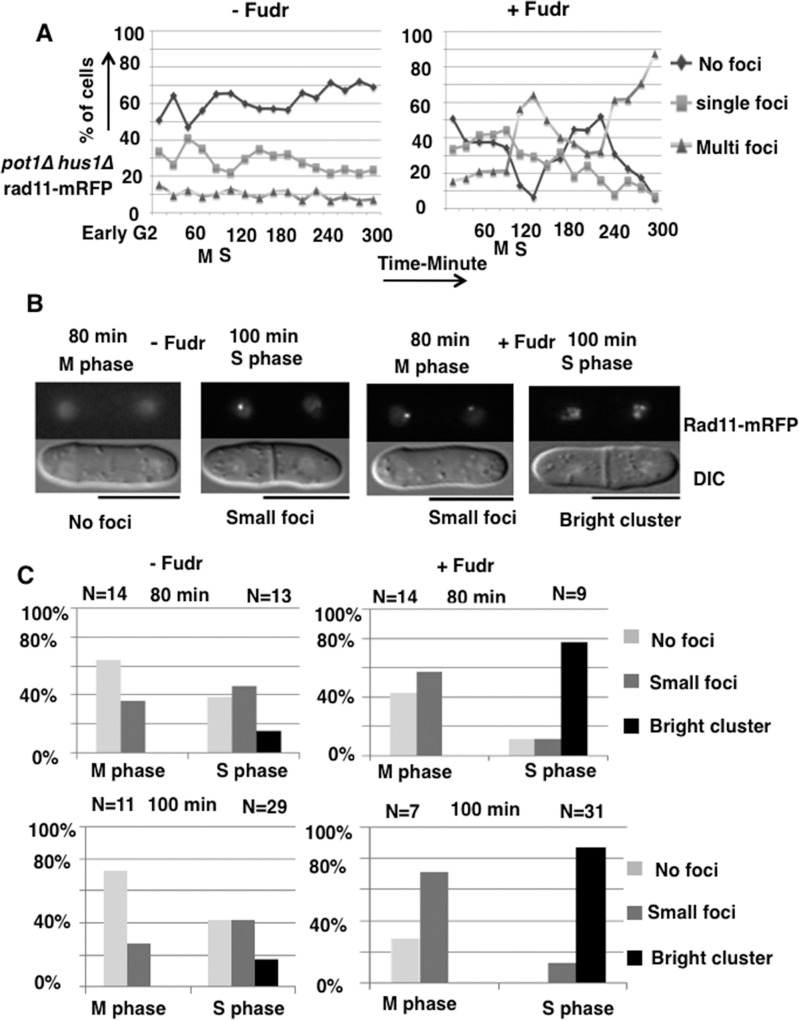
Thymidine kinase converts 5-fluorodeoxyuridine to 5-fluorodeoxyuridine monophosphate, which causes disruption of deoxynucleotide triphosphate ratios. The fission yeast Schizosaccharomyces pombe does not express endogenous thymidine kinase but 5-fluorodeoxyuridine inhibits growth when exogenous thymidine kinase is expressed. Unexpectedly, we found that 5-fluorodeoxyuridine causes S phase arrest even without thymidine kinase expression. DNA damage checkpoint proteins such as the 9-1-1 complex were required for viability in the presence of 5-fluorodeoxyuridine. We also found that strains with circular chromosomes, due to loss of pot1+, which have higher levels of replication stress, were more sensitive to loss of the 9-1-1 complex in the presence of 5-fluorodeoxyuridine. Thus, our results suggest that strains carrying circular chromosomes exhibit a greater dependence on DNA damage checkpoints to ensure viability in the presence of 5-fluorodeoxyuridine compared to stains that have linear chromosomes.


Conflict of interest statement

Competing Interests: The authors have declared that no competing interests exist.

Figures

Fig 1
Fig 1. pot1Δ hus1Δ and pot1Δ rad1Δ cells exhibit telomere loss and circularized chromosomes.
(A) Fudr conversion to FdUMP by thymidine kinase (TK) [3]. (B) In cell, dUMP is converted to dTMP by thymidilate synthase (TS) but FdUMP inhibits the thymidilate synthase resulting in no or very low amounts of dTMP and dTTP production that hamper the DNA replication process [3]. (C) Chemical structure of 5-FU. (D) The telomeres of wild-type (WT), hus1Δ, rad1Δ, pot1Δ hus1Δ and pot1Δ rad1Δ cells were analyzed using Southern hybridization at 30°C. Genomic DNA was digested with EcoRI and separated by 1.5% agarose gel electrophoresis. A DNA fragment containing telomeric DNA was used as a probe [18]. The Ethidium bromide (EtBr) image shows approximately the same amount of DNA is loaded into the all lanes. Bands with strong telomere signal are denoted ‘Telomere signal’. The weak bands above the telomere signal are either non-specific bands or telomere bands that are not fully digested by EcoRI. Sizes of marker are shown. (E) Diagram of restriction enzyme sites around the telomere and telomere associated sequences (TAS1 and TAS2) of a chromosome arm cloned in the plasmid pNSU70 [18]. The scale bar corresponds to 1 kb. (F) (Left) EtBr stained PFGE agarose gel. (Middle) NotI-digested S. pombe chromosomal DNA from the wild-type (WT), a pot1Δ isolate, a pot1Δ hus1Δ isolate, and a pot1Δ rad1Δ isolate were analyzed by PFGE. Probes for the telomeric NotI fragments (M, L, I, and C) were used [19]. The asterisk indicates a non-specific band present in all lanes. The arrow indicates a non-specific band present only in lanes 2, 3, and 4. The weak band corresponding to the size similar to C+M signal in lane 1 is a non-specific band. The size of chromosome end fragments digested by NotI, M, L, I, C, I+L, and C+M, are shown [19]. (Right) Probes for the telomeric NotI fragments (C, M, I+L) were used separately to show that the C+M signal in pot1Δ rad1Δ double mutant overlaps with L+I signal. (G) NotI restriction site map of S. pombe chromosomes. Chromosomes I, II, and III (Ch. I, Ch. II, and Ch. III) are shown. The scale corresponds to 1Mpb.
Fig 2
Fig 2. hus1Δ and rad1Δ cells are sensitive to HU, MMS, and Fudr especially in the absence of Pot1.
(A) Drug sensitivity of wild-type (WT), pot1Δ, rad1Δ, pot1Δ rad1Δ, hus1Δ, and pot1Δ hus1Δ cells was determined using a spot assay. Logarithmically growing S. pombe were serially diluted 10-fold and spotted onto YEA plates as the control and on YEA plates containing HU, MMS, Fudr, or 5-FU at the indicated concentrations. The plates were incubated at 30°C for four days. (B) Sensitivity of pot1Δ rad9Δ double mutants to Fudr. WT pot1Δ, rad9Δ, and pot1Δ rad9Δ cells were assayed as on YEA plates containing Fudr. (C-D) FACS analysis of cell cycle progression of WT, pot1Δ, hus1Δ, and pot1Δ hus1Δ double mutant cells incubated with 300 μM Fudr and 12 mM HU for 1, 2 and 3 h at 30°C. The data of WT cells arrested in G1 phase by nitrogen starvation are shown above the WT data.
Fig 3
Fig 3. Fudr treatment induces chromosome segregation defects and RPA foci.
(A) Representative images of chromosome segregation defects (left and middle panels), RPA foci (upper right panel) and normal fluorescence micrograph (lower right panel) of Rad11-mRFP expressing hus1Δ cells after 3 h incubation with Fudr are shown. Top image RFP, bottom image, RFP and DIC merged image. Examples of cut phenotype, where the septum bisects the nucleus (upper left), and non-disjunction, where the chromosome fail to separate (middle panel), are shown. The bar under the image represents 5 μm. (B-C) Analysis of chromosome segregation defects after Fudr and HU treatment. Wild-type (WT), pot1Δ, hus1Δ and pot1Δ hus1Δ strains that contain Rad11(RPA)-mRFP were incubated with 300 μM Fudr or 12 mM HU for 3 h at 30°C. All types of segregation defects were scored together. Percentages of defects in chromosome segregation in cells at time 0 and 3 h following the exposure to Fudr and HU are shown. Segregation defects were scored in two independent experiments, and the bar charts show the average values ± standard error. The y axis denotes the percentage of cells that showed chromosome segregation defects among the total number of cells. The numbers of cells examined (N) are shown at the top. (D-E) Analysis of RPA foci formation after exposure to Fudr or HU. WT, pot1Δ, hus1Δ and pot1Δ hus1Δ strains that contain Rad11-mRFP were incubated with 300 μM Fudr or 12 mM HU for 3 h at 30°C. % of cells with RPA foci were scored at (0 h) and after incubating (3 h) at 30°C with 300 μM Fudr (D) or 12 mM HU (E) in two independent experiments. The bar charts show the average values ± standard error. Values a and b linked by lines are significantly different at p< 0.05 (Statistical analysis ANOVA single factor followed by Duncan’s multiple ranges for multiple comparison tests). The numbers of cells examined (N) are shown at the top.
Fig 4
Fig 4. Fudr causes chromosome segregation defects only after S phase progression in hus1Δ and pot1Δ hus1Δ cells.
Wild-type (WT), pot1Δ, hus1Δ, and pot1Δ hus1Δ cells were synchronized using lactose gradient and early G2 cells were incubated YEA liquid medium with Fudr 300 μM at 30°C, and cell cycle progression analyzed using DAPI staining and septation index in every 20 min from 0 to 300 min. The y axis denotes the percentage of cells that showed M phase cells, septation index and chromosome segregation defects among the total number of cells.
Fig 5
Fig 5. Fudr induces ssDNA in S phase in pot1Δ hus1Δ cells.
(A) The pot1Δ hus1Δ cells that contained Rad11-mRFP were analyzed for RPA foci. Cells synchronized in early G2 using lactose gradients were incubated in YEA liquid medium with Fudr 300 μM at 30°C and samples were taken for RPA foci analysis every 20 min from 0 to 300 min. The y axis indicates the percentage of cells that exhibited no foci, single foci and multi foci among the total number of cells. (B) Representative mitotic (M phase) (binucleates without septum) and S phase (binucleates with septum) cells with no RPA foci, small RPA foci and bright RPA cluster foci in the absence and presence of Fudr at time points 80 min and 100 min after release from early G2 phase. The bar under the image represents 10 μm. (C) Number of no foci, small foci and bright cluster foci counted in M phase and S phase cells at 80 min and 100 min after release from early G2.

Similar articles

Cited by

References

    1. Sakamoto K, Yokogawa T, Ueno H, Oguchi K, Kazuno H, Ishida K, et al. Crucial roles of thymidine kinase 1 and deoxyUTPase in incorporating the antineoplastic nucleosides trifluridineand 2'-deoxy-5-fluorouridine into DNA. Int J Oncol. 2015;46: 2327–2334. doi: 10.3892/ijo.2015.2974 - DOI - PMC - PubMed
    1. Wilson PM, Danenberg PV, Johnston PG, Lenz HJ, Ladner RD. Standing the test of time: targeting thymidylate biosynthesis in cancer therapy. Nat Rev Clin Oncol. 2014;11: 282–298. doi: 10.1038/nrclinonc.2014.51 - DOI - PubMed
    1. Longley DB, Harkin DP, Johnston PG. 5-fluorouracil: mechanisms of Action and clinical strategies. Nat Rev Cancer. 2003;3: 330–338. doi: 10.1038/nrc1074 - DOI - PubMed
    1. Huehls AM, Wagner JM, Huntoon CJ, Geng L, Erlichman C, Patel AG, et al. Poly (ADP-Ribose) polymerase inhibition synergizes with 5-fluorodeoxyuridine but not 5-fluorouracil in ovarian cancer cells. Cancer Res. 2011;71: 4944–4954. doi: 10.1158/0008-5472.CAN-11-0814 - DOI - PMC - PubMed
    1. Delacroix S, Wagner JM, Kobayashi M, Yamamoto K, Karnitz LM. The Rad9-Hus1-Rad1 (9-1-1) clamp activates checkpoint signaling via TopBP1. Genes Dev. 2007;21: 1472–1477. doi: 10.1101/gad.1547007 - DOI - PMC - PubMed

MeSH terms

LinkOut - more resources