

Habitat suitability and movement corridors of grey wolf (Canis lupus) in Northern Pakistan
- PMID: 29121089
- PMCID: PMC5679527
- DOI: 10.1371/journal.pone.0187027
Habitat suitability and movement corridors of grey wolf (Canis lupus) in Northern Pakistan
Abstract
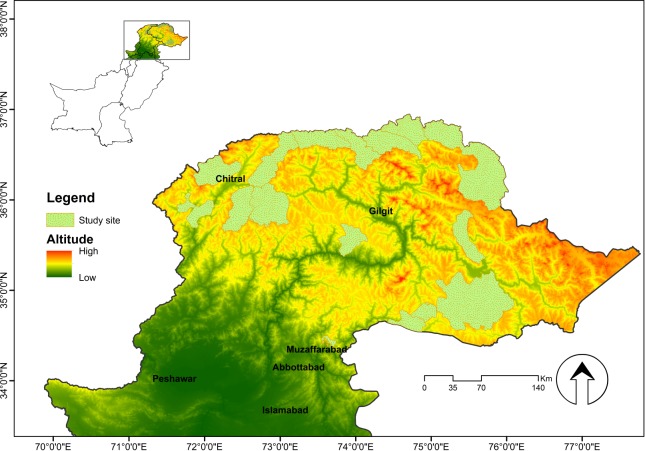
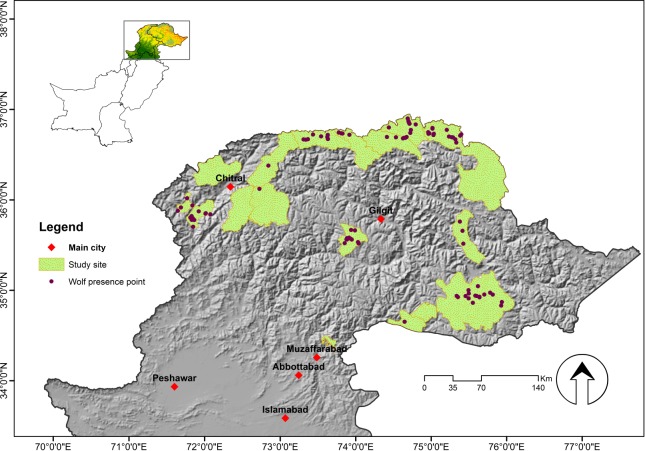
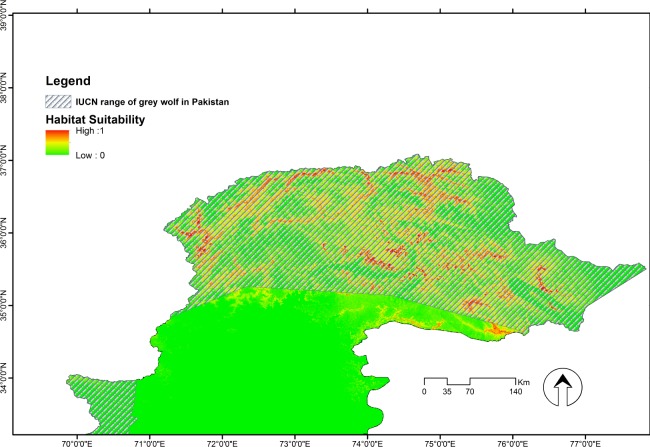
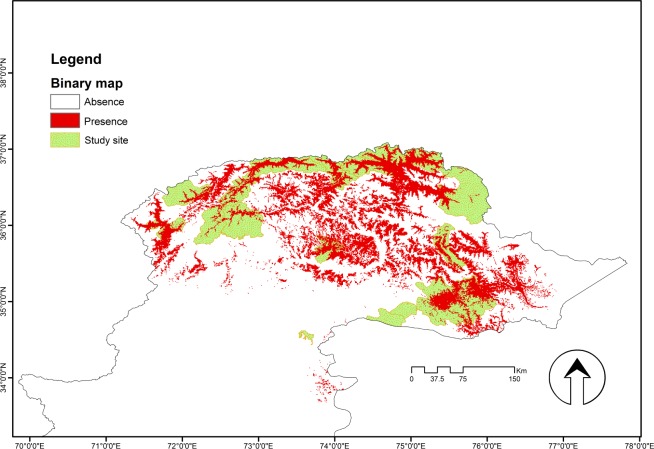
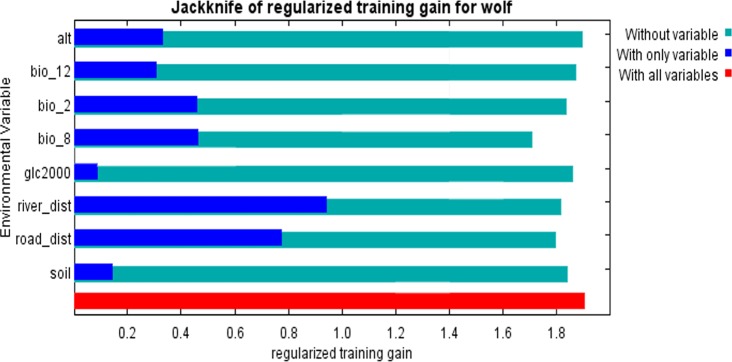
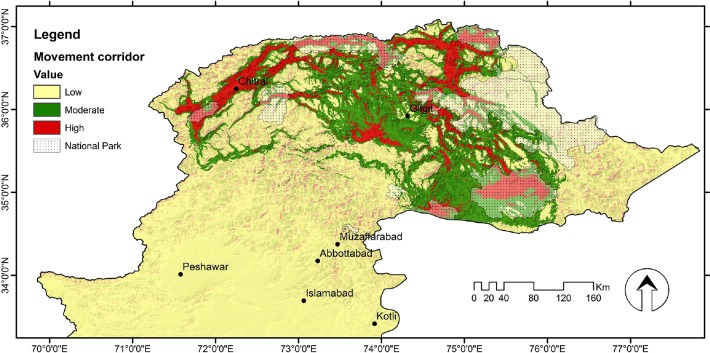
Habitat suitability models are useful to understand species distribution and to guide management and conservation strategies. The grey wolf (Canis lupus) has been extirpated from most of its historic range in Pakistan primarily due to its impact on livestock and livelihoods. We used non-invasive survey data from camera traps and genetic sampling to develop a habitat suitability model for C. lupus in northern Pakistan and to explore the extent of connectivity among populations. We detected suitable habitat of grey wolf using a maximum entropy approach (Maxent ver. 3.4.0) and identified suitable movement corridors using the Circuitscape 4.0 tool. Our model showed high levels of predictive performances, as seen from the values of area under curve (0.971±0.002) and true skill statistics (0.886±0.021). The main predictors for habitat suitability for C. lupus were distances to road, mean temperature of the wettest quarter and distance to river. The model predicted ca. 23,129 km2 of suitable areas for wolf in Pakistan, with much of suitable habitat in remote and inaccessible areas that appeared to be well connected through vulnerable movement corridors. These movement corridors suggest that potentially the wolf range can expand in Pakistan's Northern Areas. However, managing protected areas with stringent restrictions is challenging in northern Pakistan, in part due to heavy dependence of people on natural resources. The habitat suitability map provided by this study can inform future management strategies by helping authorities to identify key conservation areas.
Conflict of interest statement
Figures
Similar articles
-
Identifying suitable habitat and corridors for Indian Grey Wolf (Canis lupus pallipes) in Chotta Nagpur Plateau and Lower Gangetic Planes: A species with differential management needs.PLoS One. 2019 Apr 10;14(4):e0215019. doi: 10.1371/journal.pone.0215019. eCollection 2019. PLoS One. 2019. PMID: 30969994 Free PMC article.
-
Elk migration patterns and human activity influence wolf habitat use in the Greater Yellowstone Ecosystem.Ecol Appl. 2012 Dec;22(8):2293-307. doi: 10.1890/11-1829.1. Ecol Appl. 2012. PMID: 23387126
-
Identifying priority landscapes for conservation of snow leopards in Pakistan.PLoS One. 2020 Nov 5;15(11):e0228832. doi: 10.1371/journal.pone.0228832. eCollection 2020. PLoS One. 2020. PMID: 33151925 Free PMC article.
-
Predicting the Spatial Distribution of Wolf (Canis lupus) Breeding Areas in a Mountainous Region of Central Italy.PLoS One. 2015 Jun 2;10(6):e0124698. doi: 10.1371/journal.pone.0124698. eCollection 2015. PLoS One. 2015. PMID: 26035174 Free PMC article.
-
How many wolves (Canis lupus) fit into Germany? The role of assumptions in predictive rule-based habitat models for habitat generalists.PLoS One. 2014 Jul 16;9(7):e101798. doi: 10.1371/journal.pone.0101798. eCollection 2014. PLoS One. 2014. PMID: 25029506 Free PMC article.
Cited by
-
Simulating impacts of rapid forest loss on population size, connectivity and genetic diversity of Sunda clouded leopards (Neofelis diardi) in Borneo.PLoS One. 2018 Sep 12;13(9):e0196974. doi: 10.1371/journal.pone.0196974. eCollection 2018. PLoS One. 2018. PMID: 30208031 Free PMC article.
-
Status and Magnitude of Grey Wolf Conflict with Pastoral Communities in the Foothills of the Hindu Kush Region of Pakistan.Animals (Basel). 2019 Oct 11;9(10):787. doi: 10.3390/ani9100787. Animals (Basel). 2019. PMID: 31614682 Free PMC article.
-
Hide-and-Seek in a Highly Human-Dominated Landscape: Insights into Movement Patterns and Selection of Resting Sites of Rehabilitated Wolves (Canis lupus) in Northern Italy.Animals (Basel). 2022 Dec 22;13(1):46. doi: 10.3390/ani13010046. Animals (Basel). 2022. PMID: 36611657 Free PMC article.
-
Ecological niche modeling of genetic lineages of the great gerbil, Rhombomys opimus (Rodentia: Gerbillinae).PLoS One. 2021 Sep 2;16(9):e0257063. doi: 10.1371/journal.pone.0257063. eCollection 2021. PLoS One. 2021. PMID: 34473767 Free PMC article.
-
Improving species distribution models of zoonotic marine parasites.Sci Rep. 2019 Jul 8;9(1):9851. doi: 10.1038/s41598-019-46127-6. Sci Rep. 2019. PMID: 31285445 Free PMC article.
References
-
- Bosso L, Mucedda M, Fichera G, Kiefer A, Russo D. A gap analysis for threatened bat populations on Sardinia. Hystrix. 2016;27(2). doi: 10.4404/hystrix-27.2–11788 - DOI
-
- Hirzel AH, Helfer V, Metral F. Assessing habitat-suitability models with a virtual species. Ecol Model. 2001;145(2–3): 111–121. doi: 10.1016/S0304-3800(01)00396-9 - DOI
-
- Jarvis AM, Robertson A. Predicting population sizes and priority conservation areas for 10 endemic Namibian bird species. Biol Cons. 1999;88(1): 121–131. doi: 10.1016/S0006-3207(98)00060-3 - DOI
-
- Sheehan KL, Esswein ST, Dorr BS, Yarrow GK, Johnson RJ. Using species distribution models to define nesting habitat of the eastern metapopulation of double‐crested cormorants. Ecol Evol. 2017;7(1): 409–418. doi: 10.1002/ece3.2620 - DOI - PMC - PubMed
-
- Smeraldo S, Di Febbraro M, Ćirović D, Bosso L, Trbojević I, Russo D. Species distribution models as a tool to predict range expansion after reintroduction: A case study on Eurasian beavers (Castor fiber). J Nat Conserv. 2017;37: 12–20. doi: 10.1016/j.jnc.2017.02.008 - DOI
MeSH terms
LinkOut - more resources
Full Text Sources
Other Literature Sources
