. 2018 Oct 8;73(11):1465-1471.
doi: 10.1093/gerona/glx219.

Breaking the Ceiling of Human Maximal Life span

Affiliations

Breaking the Ceiling of Human Maximal Life span

Moshe Shay Ben-Haim et al. J Gerontol A Biol Sci Med Sci. .

Abstract

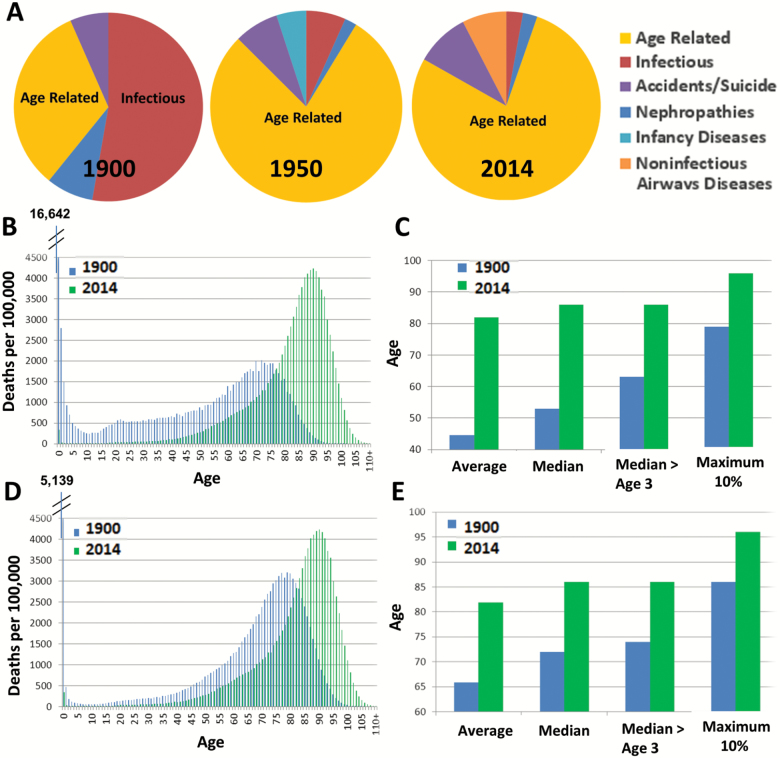
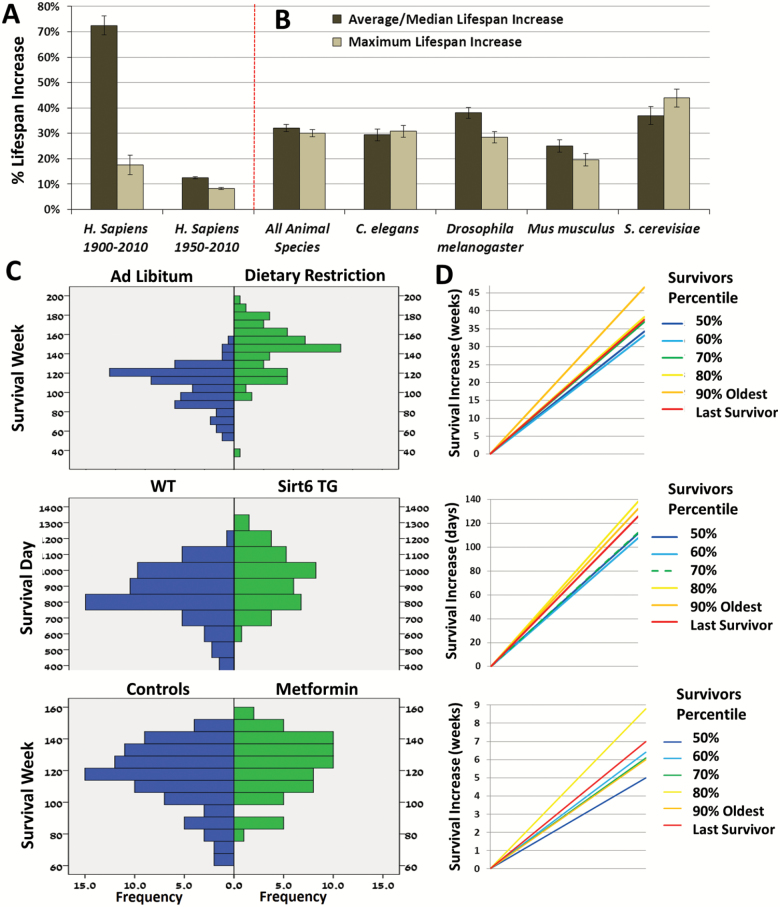
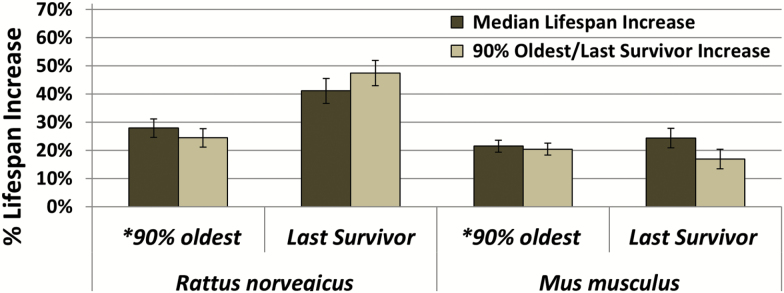
While average human life expectancy has increased dramatically in the last century, the maximum life span has only modestly increased. These observations prompted the notion that human life span might have reached its maximal natural limit of ~115 years. To evaluate this hypothesis, we conducted a systematic analysis of all-cause human mortality throughout the 20th century. Our analyses revealed that, once cause of death is accounted for, there is a proportional increase in both median age of death and maximum life span. To examine whether pathway targeted aging interventions affected both median and maximum life span, we analyzed hundreds of interventions performed in multiple organisms (yeast, worms, flies, and rodents). Three criteria: median, maximum, and last survivor life spans were all significantly extended, and to a similar extent. Altogether, these findings suggest that targeting the biological/genetic causes of aging can allow breaking the currently observed ceiling of human maximal life span.


Figures

Figure 1.
Figure 1.
Human mortality distributions and causes of death throughout the 20th–21st Century. (A) frequencies of the top 10 causes of death in 1900, 1950, and 2014, data from the Centers for Disease Control and Prevention. The diseases categorized as infections were Pneumonia, influenza, tuberculosis, gastrointestinal infections, and diphtheria. The diseases categorized as age-related were Heart disease, Stroke, Cancer, Senility, Alzhemier’s diseases, Diabetes, and General Arteriosclerosis. (B, D) Calculated deaths per 100,000 individuals in France in 1900 and 2014 (B) and 1950 and 2014 (D) extracted from the Human Mortality Database. (C, E) Average; median; median > age of 3; and the maximum 90th percentiles (> age of 3) of the 1900 to 2014 (C) and 1950 to 2014 (E) mortality distributions.
Figure 2.
Figure 2.
Life span distribution increases across species. (A) The mean % increases in average life span and maximum life span in (from left to right): human 1900 and 2010 maximum 90% percentile verses standard average life span increase in all countries with data from 1900 in the Human Mortality Database (10 countries). The % increase was calculated as (2010–1900)/average of 1900; Human 1950 and 2010 maximum 90% percentile verses median > age 3 life span increase in all countries with data from 1950 in the Human Mortality Database (23 countries). The % increase was calculated as (2010–1950)/median > age 3 of 1950; Data are represented as mean of countries data ± SEM. (B) Across species showing increased life span in the GenAge database using the GenAge categories of average or median (combined) and maximum life span change as reported in the dataset based on original studies N = 127 genetic interventions; in C. elegance N = 57 interventions; in Drosophila melanogaster N = 35 interventions; in Mus musculus N = 19 interventions; and S. cerevisiae N = 16 interventions. Data are represented as mean of studies data ± SEM. (C) Mortality distribution histograms of nutritional, genetic, and pharmacological interventions: in mice undergoing 20% calorie restriction, (15); in Sirt6 transgenic male mice (16); and male mice supplemented with 0.1% metformin (17). (D) The corresponding % change in life span in different aging percentiles and last survivor individual mice in CR mice; Sirt6 TG mice; and metformin supplemented mice.
Figure 3.
Figure 3.
Effects of nutritional dietary restriction on median and maximum life span. The mean % increases in median life span and maximum life span of all studies showing increased life span in dietary restriction as published in the meta-analysis of (22) in Rattus norvegicus (left panel) compared to the *maximum 90% percentile (21 studies), 75% percentile (1 study) or average of last 10% survivors (5 studies); and in studies comparing to the last individual survivors in the cohort (23 studies; second panel); and in Mus musculus (right panels) compared to the *maximum 90% percentile (12 studies), average of last 10% survivors (15 studies), or last 20% survivors (3 studies); and in studies comparing to the last individual survivors in the cohort (79 studies; last panel). The % increase was calculated as (dietary restriction – control)/average of control. Data are represented as mean of studies data ± SEM.

References

    1. Fries JF. Aging, natural death, and the compression of morbidity. 1980. Bull World Health Organ. 2002;80:245–250. - PMC - PubMed
    1. Oeppen J, Vaupel JW. Demography. Broken limits to life expectancy. Science. 2002;296:1029–1031. doi:10.1126/science.1069675 - PubMed
    1. Olshansky SJ, Carnes BA, Cassel C. In search of Methuselah: estimating the upper limits to human longevity. Science. 1990;250:634–640. - PubMed
    1. Vaupel JW. Biodemography of human ageing. Nature. 2010;464:536–542. doi:10.1038/nature08984 - PMC - PubMed
    1. Wang C, Li Q, Redden DT, Weindruch R, Allison DB. Statistical methods for testing effects on “maximum lifespan”. Mech Ageing Dev. 2004;125:629–632. doi:S0047-6374(04)00149-6 [pii] - PubMed

Publication types