. 2017 Dec 15;45(22):12834-12847.
doi: 10.1093/nar/gkx1047.

PARP1 changes from three-dimensional DNA damage searching to one-dimensional diffusion after auto-PARylation or in the presence of APE1

Affiliations

PARP1 changes from three-dimensional DNA damage searching to one-dimensional diffusion after auto-PARylation or in the presence of APE1

Lili Liu et al. Nucleic Acids Res. .

Abstract

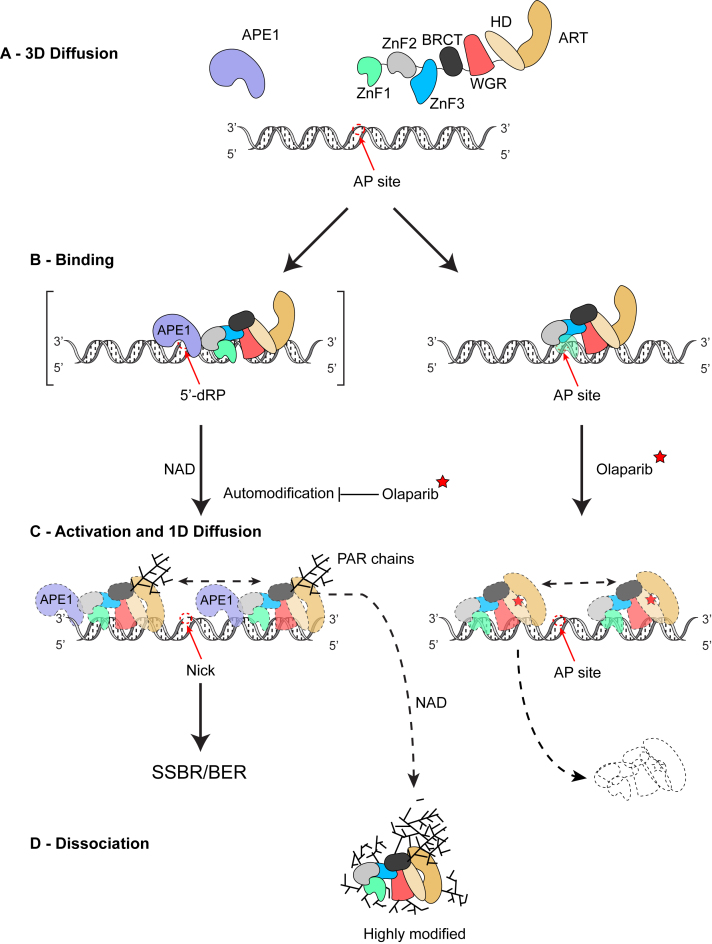
PARP1-dependent poly-ADP-ribosylation (PARylation) participates in the repair of many forms of DNA damage. Here, we used atomic force microscopy (AFM) and single molecule fluorescence microscopy to examine the interactions of PARP1 with common DNA repair intermediates. AFM volume analysis indicates that PARP1 binds to DNA at nicks, abasic (AP) sites, and ends as a monomer. Single molecule DNA tightrope assays were used to follow the real-time dynamic behavior of PARP1 in the absence and presence of AP endonuclease (APE1) on AP DNA damage arrays. These experiments revealed that PARP1 conducted damage search mostly through 3D diffusion. Co-localization of APE1 with PARP1 on DNA was found capable of inducing 1D diffusion of otherwise nonmotile PARP1, while excess APE1 also facilitated the dissociation of DNA-bound PARP1. Moreover, auto-PARylation of PARP1 allowed the protein to switch its damage search strategy by causing a 3-fold increase in linear diffusion. Finally, we demonstrated that PARP inhibitor olaparib did not significantly alter the rate of PARP1 dissociation from DNA, but instead resulted in more motility of DNA-bound PARP1 molecules.


Figures

Figure 1.
Figure 1.
PARP1 binds to abasic sites and DNA ends as a monomer. (A) 3D view of AFM image of PARP1 binding to 538 bp DNA fragments with abasic (AP) sites at 30% contour length from one end (AP538). Red arrows indicate DNA-bound PARP1, cyan arrows indicate free PARP1, and white arrows indicate free BSA. Scan area 1 μm × 1 μm. (B) Bar graph of end versus internal binding events of PARP1 on AP538 (N = 273). (C) Histogram of internal binding positions of PARP1 along AP538 (N = 136). Solid curve represents a Gaussian fitting to the distribution data, centered at formula image. (D) and (E) Histograms of volume distributions for PARP1 bound at DNA ends (N = 126) and AP sites (N = 113), respectively. Solid curves represent Gaussian fittings to data. Black arrows indicate the positions of expected dimer volume peaks (451 nm3). For end binding (D), the fitted curve is centered at formula image, corresponding to a molecular weight of formula image. For specific binding at AP sites (between 20% and 40%) (E), the fitted curve is centered at formula image corresponding to a molecular weight of formula image. The predicted molecular weight of monomeric His-MBP-TEV-PARP1 is formula image.
Figure 2.
Figure 2.
PARP1 specifically binds to abasic site arrays embedded in long DNA substrates. (A) Schematic of the DNA tightrope assay. Long DNA substrates with AP sites at defined positions are suspended between 5 μm poly-L-lysine coated silica beads. These lesion sites can be labeled by a streptavidin (SA) Qdot (red dots) through an adjacent biotin or recognized by labeled DNA repair proteins (green dots). Co-localization of protein and lesion is shown as a yellow glow around closely positioned red and green dots. (B) Labeling of His-MBP-TEV-PARP1 by antibody sandwich (see Supplementary Information). Domains of PARP1 are colored as follows: Zinc Fingers 1, 2 and 3 in green, light gray and blue, respectively; BRCT in black; WGR in red; HD in wheat; and ART in dark yellow. (C) Still video frame and kymograph of PARP1 protein array on long DNA substrates containing defined AP sites. Positions of the silica beads are outlined by white circles. Asterisks mark the dissociating particle. Horizontal and vertical scale bars represent 5 s and 2 kp, respectively. (D) Still video frame and kymographs of Qdot605-mHisAB-PARP1 (red) binding to SA-Qdot655 labeled AP-BiodT sites (green). Color-coded red, green, and yellow arrows highlight these binding events where appropriate. Horizontal and vertical scale bars represent 50 s and 2 kb, respectively. (E) Co-localization (yellow) Venn diagrams of Qdot-labeled AP-BiodT sites (red) with Qdot-labeled PARP1 (green) on AP-BiodT DNA tightropes in the dual-color assay (N = 208). (F) Distributions of pair-wise distances between labeled AP-BiodT sites in DNA (white, N = 231, top), labeled PARP1 on AP DNA (orange, N = 26, middle), and labeled PARP1 on AP-BiodT DNA (blue, N = 28, bottom). Solid black curve represents Gaussian fitting to the distance distribution for labeled AP-BiodT sites.
Figure 3.
Figure 3.
Dynamic behavior of PARP1 on DNA containing abasic sites. (A) Bar graph showing PARP1 behavior on DNA containing AP sites (N = 129, M: Motile, D: Dissociated, M & D: Motile and Dissociated). Data from three independent experiments are shown as weighted mean ± SEM. Motile population (M) includes protein particles of all three types of movement on DNA (random, constrained, and paused). (B) Kymographs showing four different types of motion of PARP1: (I) random, (II) constrained, (III) paused, and (IV) non-motile. Horizontal and vertical scale bars represent 5 seconds and 2 kbp, respectively. (C) Bar graph showing types of motion of PARP1 on AP DNA. Data from three independent experiments are shown as weighted mean ± SEM. Note that the y-axis breaks between 10% and 80%. (D) Plot of PARP1 anomalous diffusion exponent (α factor) versus diffusion coefficient (log10D).
Figure 4.
Figure 4.
Interaction of PARP1 and APE1 on DNA containing APE1 processed abasic sites. (A) Co-localization (yellow) Venn diagrams of PARP1 (green) with APE1 (red) on APE1 processed AP DNA in the absence (left) and presence (middle) of NAD, and PARP1 (green) with mAPE1 (red) on unprocessed AP DNA in the absence of NAD (right). (B) Bar graph showing PARP1 behavior in the presence of APE1 (dark green, N = 89), APE1 and NAD (green, N = 47), and mAPE1 (light green, N = 84). Motile population (M) includes protein particles of all three types of movement on DNA (random, constrained, and paused). (C) Bar graph showing behavior of APE1 (red, N = 44) and mAPE1 (light pink, N = 63) in the presence of PARP1 (M: Motile, D: Dissociated). Motile population (M) includes protein particles of all three types of movement on DNA (random, constrained, and paused). (D) Kymographs of co-localized PARP1 (green) and APE1 (red) in the presence of NAD. (E) Kymographs of co-localized PARP1 (green) and mAPE1 (red). Horizontal and vertical scale bars represent 50 s and 2 kb, respectively.
Figure 5.
Figure 5.
Auto-PARylation of PARP1 increases its motility on APE1 processed abasic DNA. (A) Western blot of the in vitro auto-PARylation assay using 37 bp duplex DNA as a substrate for activation of PARP1. (B) Bar graph showing behavior of PARP1 (cyan, N = 118), auto-modified PARP1 from in vitro auto-PARylation reactions (AM-PARP1, purple, N = 126), highly modified PARP1 (HM-PARP1, orange, N = 27), and PARP1 in the presence of olaparib (PARP1 + olaparib, gray, N = 112). Data from three independent experiments are shown as weighted mean ± SEM (M: Motile, D: Dissociated, M & D: Motile and Dissociated). Motile population (M) includes protein particles of all three types of movement on DNA (random, constrained, and paused). Student's t-test was used to test for statistical significance in the difference between behavior of PARP1 (control, denoted by #) and that of AM-PARP1, HM-PARP1, or PARP1 + olaparib (** P < 0.005). (C) Plot of anomalous diffusion exponent (α factor) versus diffusion coefficient (log10D) for PARP1 (cyan, N = 8), AM-PARP1 (purple, N = 40), and HM-PARP1 (orange, N = 11). (D) Bar graph showing motion types of PARP1, AM-PARP1, HM-PARP1, and PARP1 in the presence of olaparib. (E) Plot of anomalous diffusion exponent (α factor) versus diffusion coefficient (log10D) for PARP1 on AP DNA  in the presence (red, N = 25) and absence (blue, N = 12) of olaparib. Data in the absence of olaparib are re-plotted from Figure 3D. Still movie frame (top) and kymograph (bottom) of AM-PARP1 on APE1 processed AP DNA (F) and PARP1 on AP DNA in the presence of olaparib (G). Corresponding particles in the movie frame and kymograph are as labeled.
Figure 6.
Figure 6.
Working model for PARP1 and APE1 dynamics at repair intermediates Model for recognition of AP sites by PARP1 (same color scheme as in Figure 2B) and APE1 (purple). See main text for details.

Similar articles

Cited by

References

    1. Ame J.C., Spenlehauer C., de Murcia G.. The PARP superfamily. Bioessays. 2004; 26:882–893. - PubMed
    1. Ko H.L., Ren E.C.. Functional aspects of PARP1 in DNA repair and transcription. Biomolecules. 2012; 2:524–548. - PMC - PubMed
    1. Benjamin R.C., Gill D.M.. Poly(ADP-ribose) synthesis in vitro programmed by damaged DNA. A comparison of DNA molecules containing different types of strand breaks. J. Biol. Chem. 1980; 255:10502–10508. - PubMed
    1. Dantzer F., Ame J.C., Schreiber V., Nakamura J., Menissier-de Murcia J., de Murcia G.. Poly(ADP-ribose) polymerase-1 activation during DNA damage and repair. Methods Enzymol. 2006; 409:493–510. - PubMed
    1. Pion E., Ullmann G.M., Ame J.C., Gerard D., de Murcia G., Bombarda E.. DNA-induced dimerization of poly(ADP-ribose) polymerase-1 triggers its activation. Biochemistry. 2005; 44:14670–14681. - PubMed

MeSH terms