

A subset of sweet-sensing neurons identified by IR56d are necessary and sufficient for fatty acid taste
- PMID: 29121639
- PMCID: PMC5697886
- DOI: 10.1371/journal.pgen.1007059
A subset of sweet-sensing neurons identified by IR56d are necessary and sufficient for fatty acid taste
Abstract
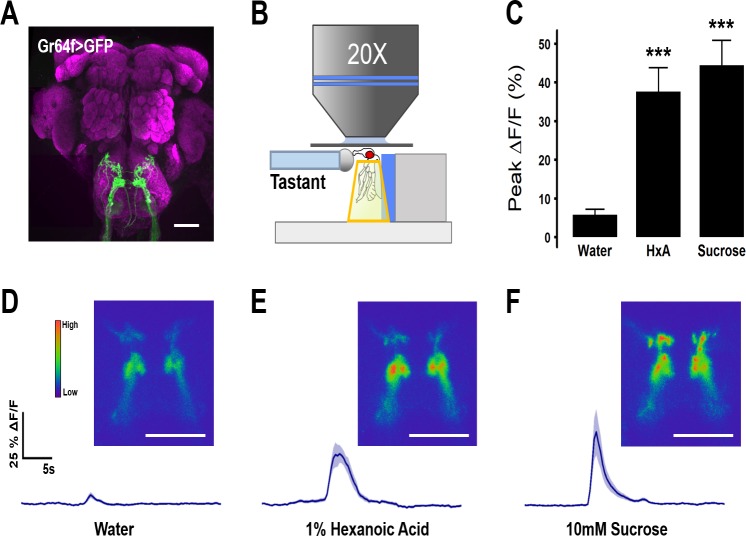
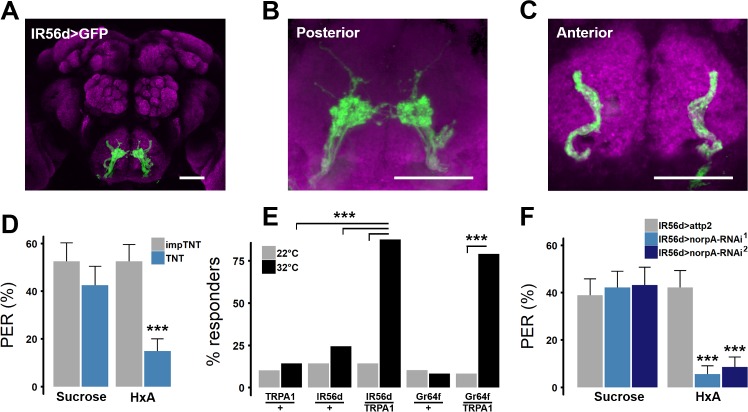
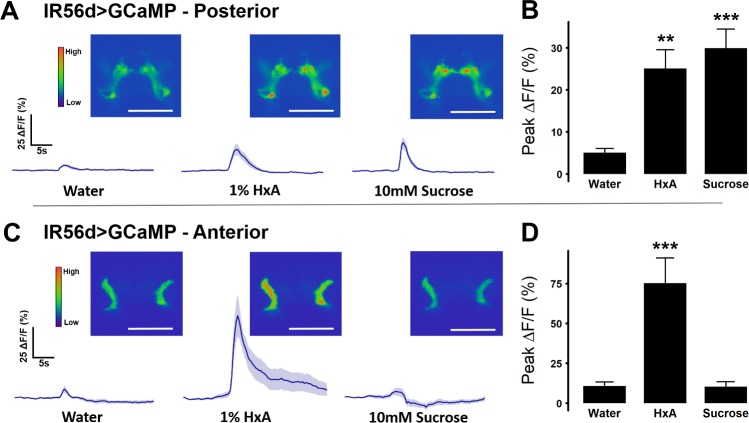
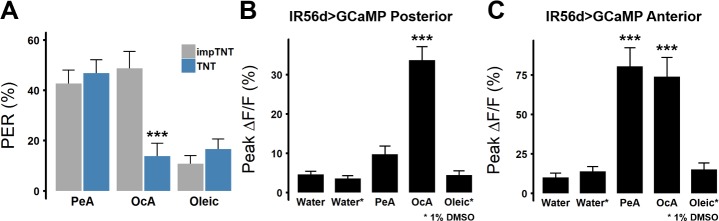
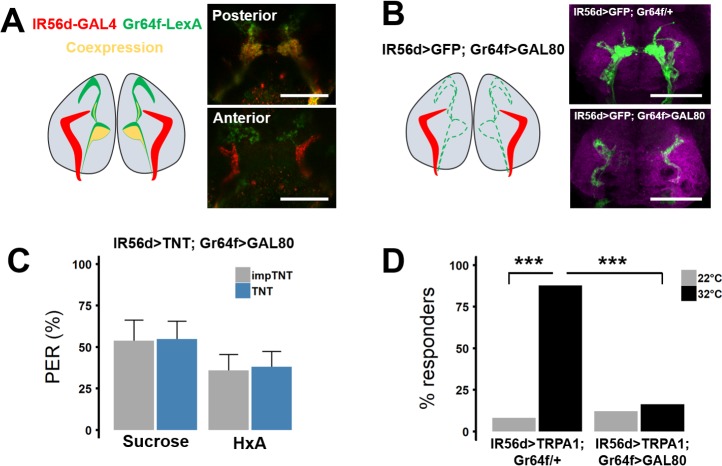
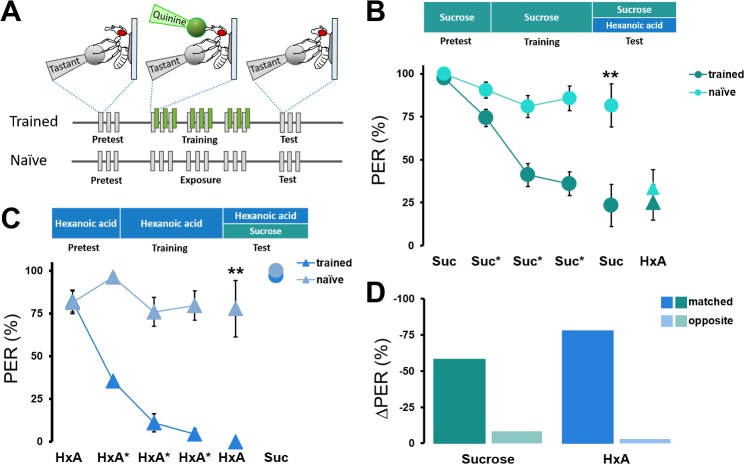
Fat represents a calorically potent food source that yields approximately twice the amount of energy as carbohydrates or proteins per unit of mass. The highly palatable taste of free fatty acids (FAs), one of the building blocks of fat, promotes food consumption, activates reward circuitry, and is thought to contribute to hedonic feeding underlying many metabolism-related disorders. Despite a role in the etiology of metabolic diseases, little is known about how dietary fats are detected by the gustatory system to promote feeding. Previously, we showed that a broad population of sugar-sensing taste neurons expressing Gustatory Receptor 64f (Gr64f) is required for reflexive feeding responses to both FAs and sugars. Here, we report a genetic silencing screen to identify specific populations of taste neurons that mediate fatty acid (FA) taste. We find neurons identified by expression of Ionotropic Receptor 56d (IR56d) are necessary and sufficient for reflexive feeding response to FAs. Functional imaging reveals that IR56d-expressing neurons are responsive to short- and medium-chain FAs. Silencing IR56d neurons selectively abolishes FA taste, and their activation is sufficient to drive feeding responses. Analysis of co-expression with Gr64f identifies two subpopulations of IR56d-expressing neurons. While physiological imaging reveals that both populations are responsive to FAs, IR56d/Gr64f neurons are activated by medium-chain FAs and are sufficient for reflexive feeding response to FAs. Moreover, flies can discriminate between sugar and FAs in an aversive taste memory assay, indicating that FA taste is a unique modality in Drosophila. Taken together, these findings localize FA taste within the Drosophila gustatory center and provide an opportunity to investigate discrimination between different categories of appetitive tastants.
Conflict of interest statement
The authors have declared that no competing interests exist.
Figures
Similar articles
-
Ir56d-dependent fatty acid responses in Drosophila uncover taste discrimination between different classes of fatty acids.Elife. 2021 May 5;10:e67878. doi: 10.7554/eLife.67878. Elife. 2021. PMID: 33949306 Free PMC article.
-
Molecular basis of fatty acid taste in Drosophila.Elife. 2017 Dec 12;6:e30115. doi: 10.7554/eLife.30115. Elife. 2017. PMID: 29231818 Free PMC article.
-
Drosophila fatty acid taste signals through the PLC pathway in sugar-sensing neurons.PLoS Genet. 2013;9(9):e1003710. doi: 10.1371/journal.pgen.1003710. Epub 2013 Sep 12. PLoS Genet. 2013. PMID: 24068941 Free PMC article.
-
Recent advances in the genetic basis of taste detection in Drosophila.Cell Mol Life Sci. 2020 Mar;77(6):1087-1101. doi: 10.1007/s00018-019-03320-0. Epub 2019 Oct 9. Cell Mol Life Sci. 2020. PMID: 31598735 Free PMC article. Review.
-
Gustatory Processing in Drosophila melanogaster.Annu Rev Entomol. 2018 Jan 7;63:15-30. doi: 10.1146/annurev-ento-020117-043331. Annu Rev Entomol. 2018. PMID: 29324046 Review.
Cited by
-
A Fly's Eye View of Natural and Drug Reward.Front Physiol. 2018 Apr 18;9:407. doi: 10.3389/fphys.2018.00407. eCollection 2018. Front Physiol. 2018. PMID: 29720947 Free PMC article. Review.
-
A single pair of pharyngeal neurons functions as a commander to reject high salt in Drosophila melanogaster.Elife. 2024 Apr 4;12:RP93464. doi: 10.7554/eLife.93464. Elife. 2024. PMID: 38573740 Free PMC article.
-
Single cell transcriptomes reveal expression patterns of chemoreceptor genes in olfactory sensory neurons of the Caribbean spiny lobster, Panulirus argus.BMC Genomics. 2020 Sep 22;21(1):649. doi: 10.1186/s12864-020-07034-7. BMC Genomics. 2020. PMID: 32962631 Free PMC article.
-
Selective integration of diverse taste inputs within a single taste modality.Elife. 2023 Jan 24;12:e84856. doi: 10.7554/eLife.84856. Elife. 2023. PMID: 36692370 Free PMC article.
-
Innate and Conditioned Taste Processing in Drosophila.Cold Spring Harb Protoc. 2023 Jun 1;2023(6):pdb.top107864. doi: 10.1101/pdb.top107864. Cold Spring Harb Protoc. 2023. PMID: 36787965 Free PMC article.
References
-
- Tepper BJ, Nurse RJ. Fat perception is related to PROP taster status. Physiol Behav. 1997;61: 949–954. - PubMed
-
- Ramirez I. Chemosensory similarities among oils: does viscosity play a role? Chem Senses. 1994;19: 155–68. - PubMed
-
- Kinney NE, Antill RW. Role of olfaction in the formation of preference for high-fat foods in mice. Physiol Behav. 1996;59: 475–478. - PubMed
-
- Greenberg D, Smith GP. The controls of fat intake. Psychosom Med. 1996;58: 559–69. - PubMed
-
- Takeda M, Sawano S, Imaizumi M, Fushiki T. Preference for corn oil in olfactory-blocked mice in the conditioned place preference test and the two-bottle choice test. Life Sci. 2001;69: 847–854. - PubMed
MeSH terms
Substances
Grants and funding
LinkOut - more resources
Full Text Sources
Other Literature Sources
Medical
Molecular Biology Databases
Research Materials
Miscellaneous
