. 2017 Nov 9;13(11):e1006721.
doi: 10.1371/journal.ppat.1006721. eCollection 2017 Nov.

Spatiotemporal dynamics of HSV genome nuclear entry and compaction state transitions using bioorthogonal chemistry and super-resolution microscopy

Affiliations

Spatiotemporal dynamics of HSV genome nuclear entry and compaction state transitions using bioorthogonal chemistry and super-resolution microscopy

Eiki Sekine et al. PLoS Pathog. .

Abstract

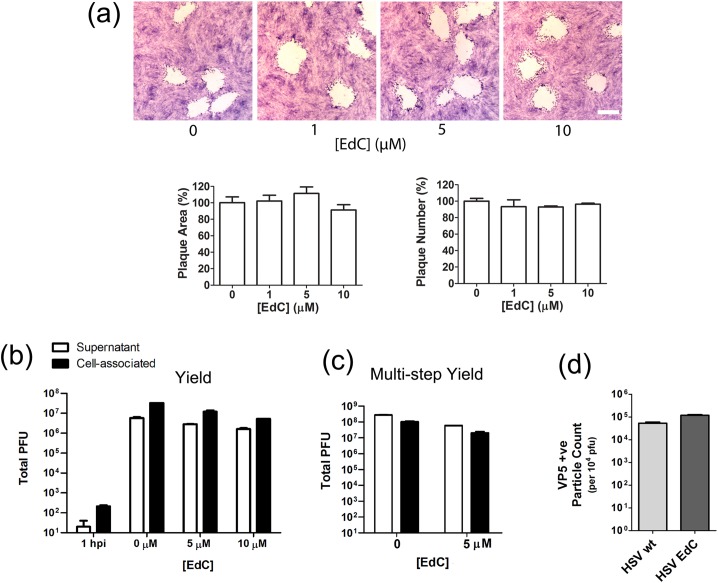
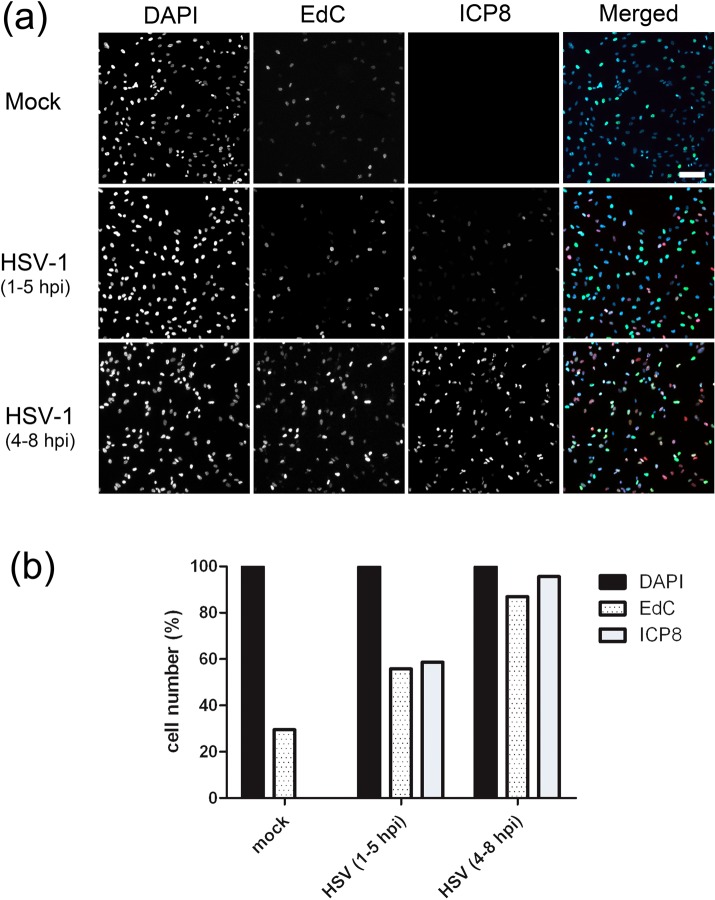
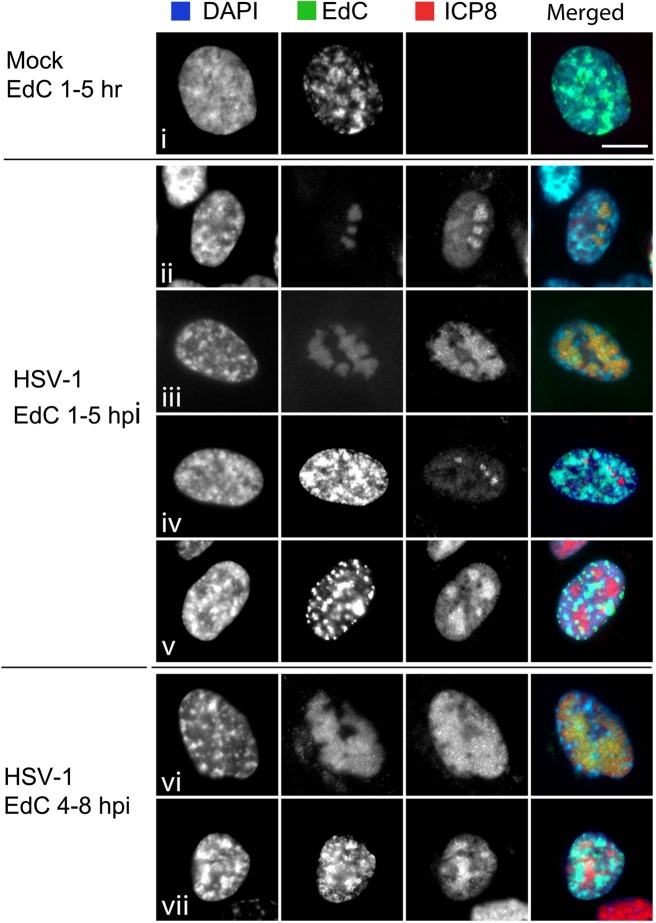
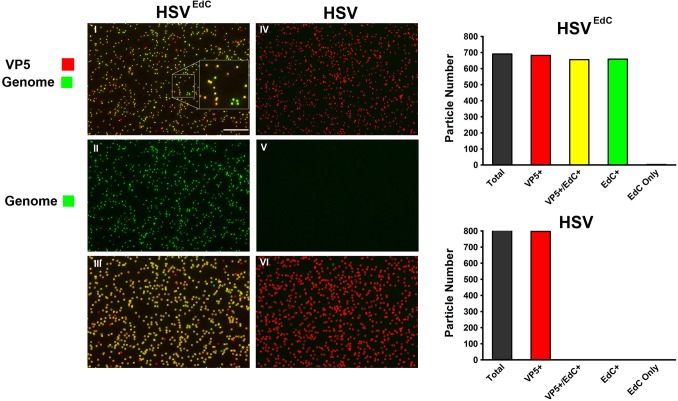
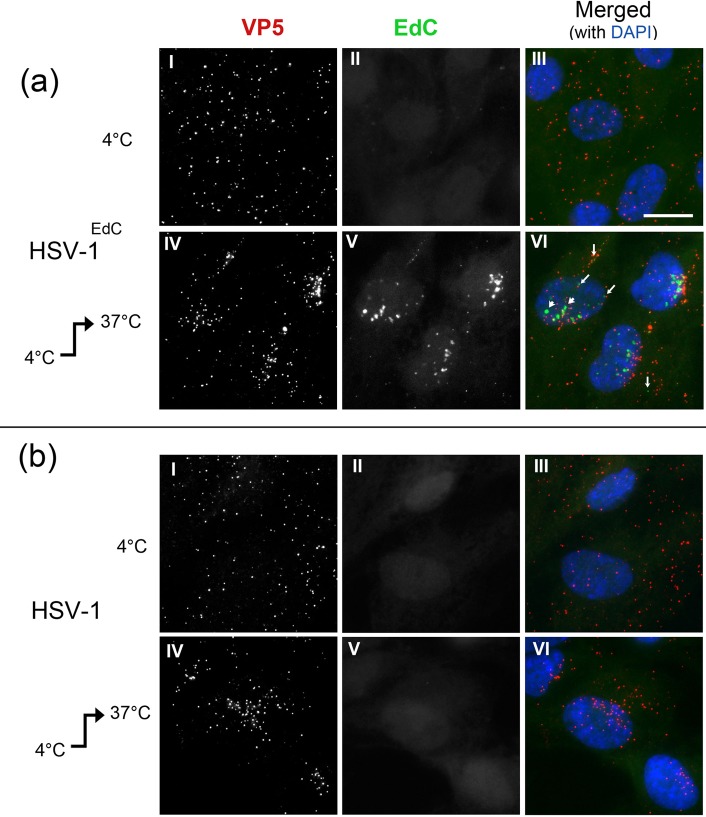
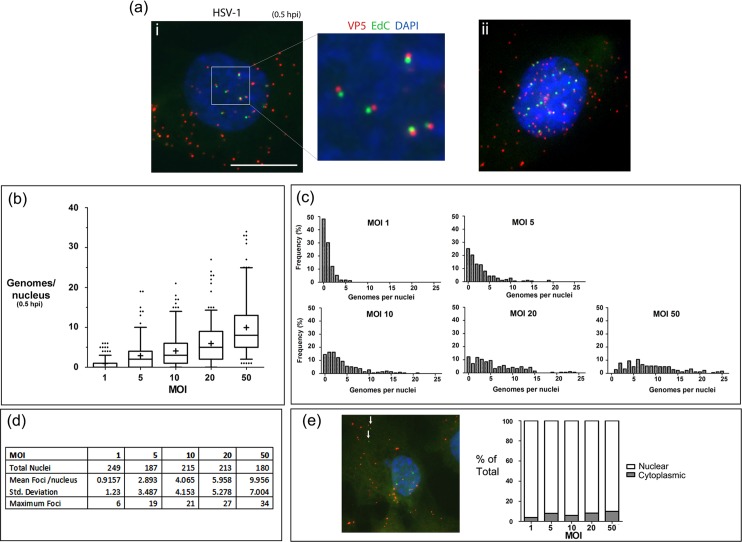
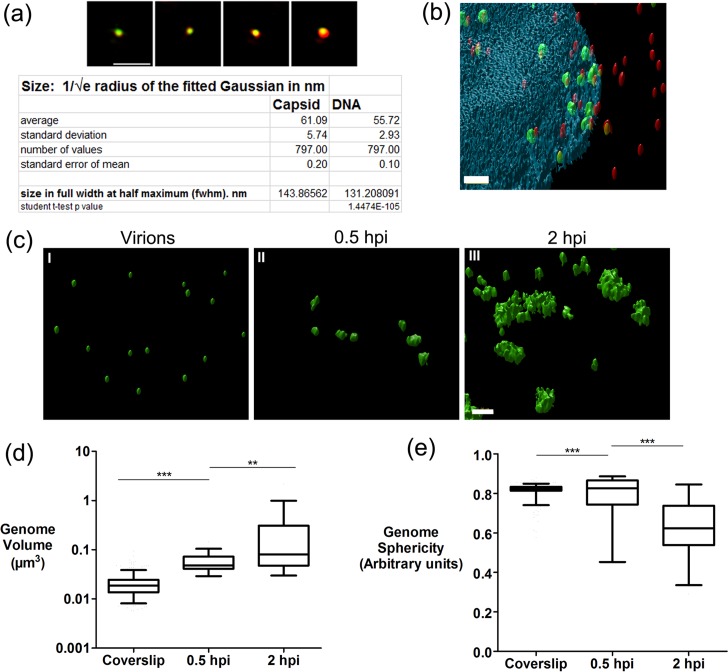
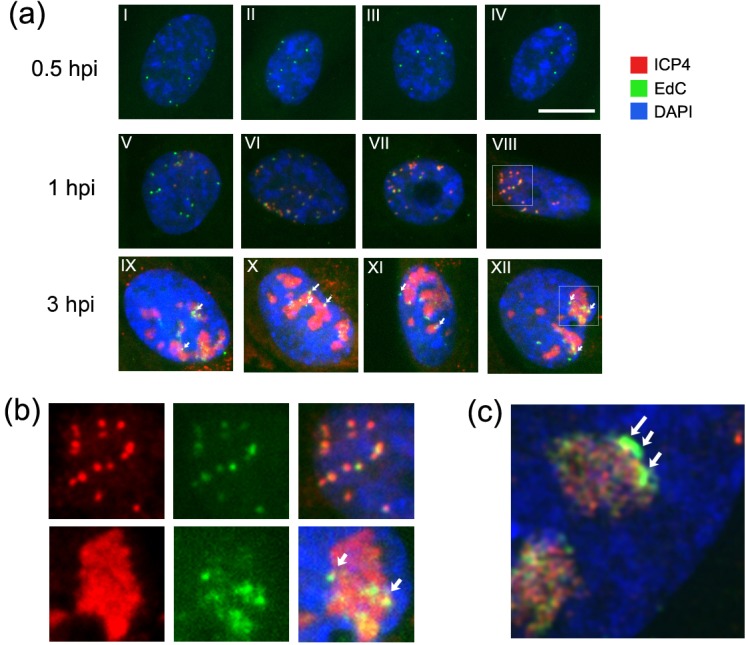
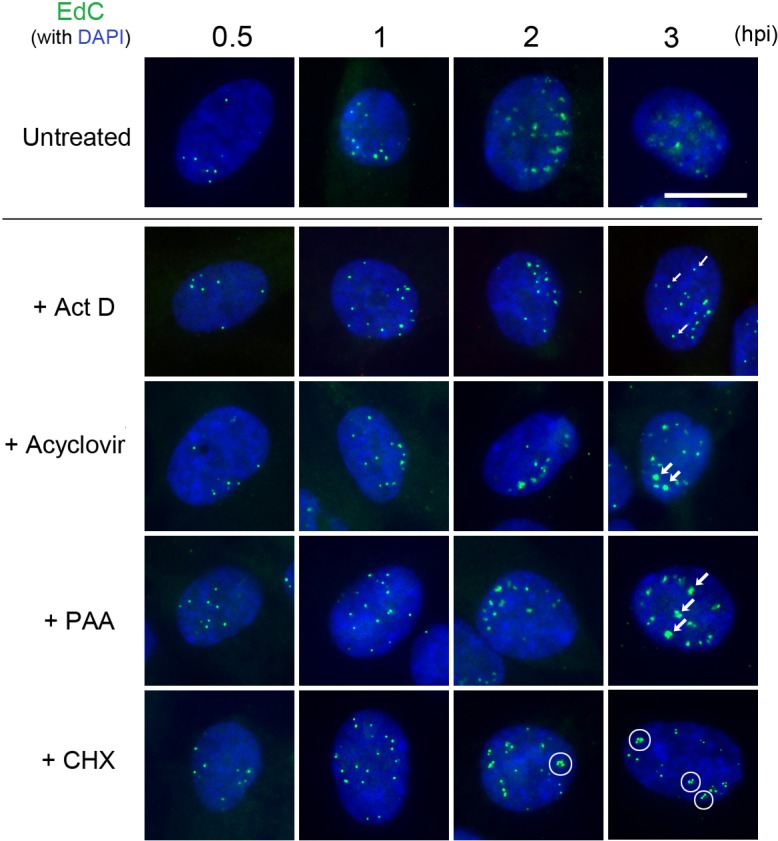
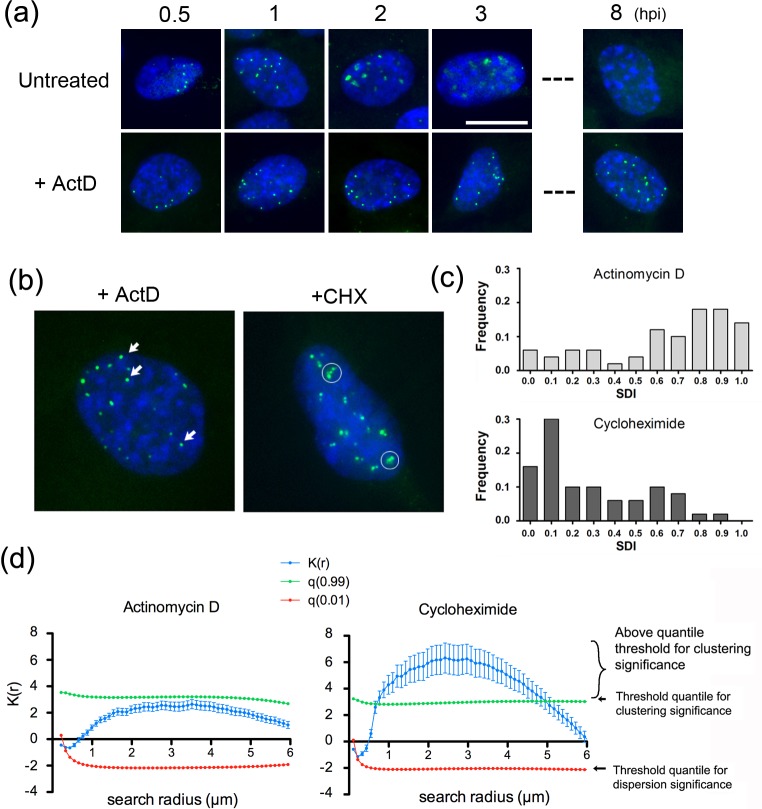
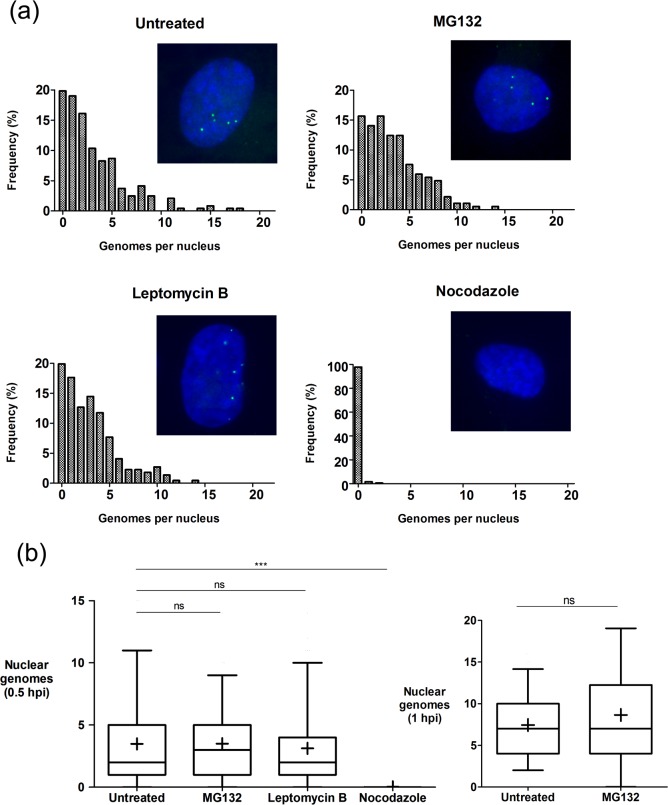
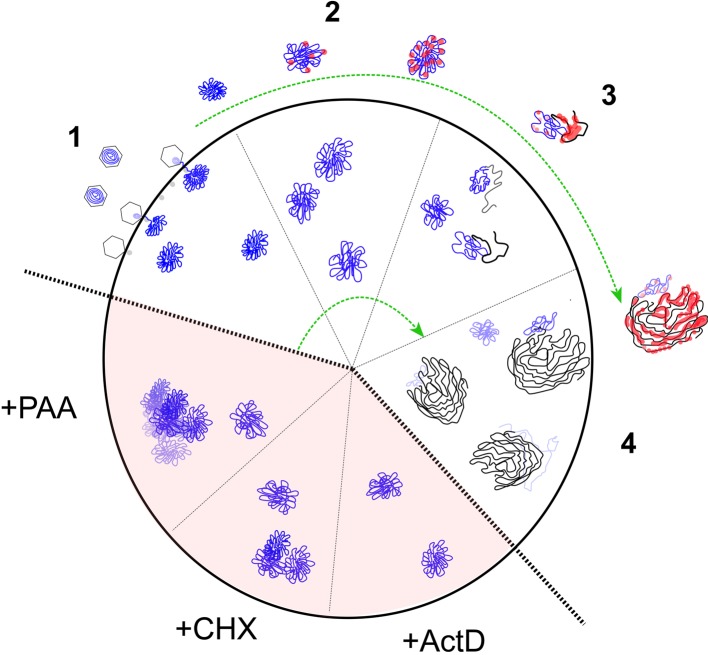
We investigated the spatiotemporal dynamics of HSV genome transport during the initiation of infection using viruses containing bioorthogonal traceable precursors incorporated into their genomes (HSVEdC). In vitro assays revealed a structural alteration in the capsid induced upon HSVEdC binding to solid supports that allowed coupling to external capture agents and demonstrated that the vast majority of individual virions contained bioorthogonally-tagged genomes. Using HSVEdC in vivo we reveal novel aspects of the kinetics, localisation, mechanistic entry requirements and morphological transitions of infecting genomes. Uncoating and nuclear import was observed within 30 min, with genomes in a defined compaction state (ca. 3-fold volume increase from capsids). Free cytosolic uncoated genomes were infrequent (7-10% of the total uncoated genomes), likely a consequence of subpopulations of cells receiving high particle numbers. Uncoated nuclear genomes underwent temporal transitions in condensation state and while ICP4 efficiently associated with condensed foci of initial infecting genomes, this relationship switched away from residual longer lived condensed foci to increasingly decondensed genomes as infection progressed. Inhibition of transcription had no effect on nuclear entry but in the absence of transcription, genomes persisted as tightly condensed foci. Ongoing transcription, in the absence of protein synthesis, revealed a distinct spatial clustering of genomes, which we have termed genome congregation, not seen with non-transcribing genomes. Genomes expanded to more decondensed forms in the absence of DNA replication indicating additional transitional steps. During full progression of infection, genomes decondensed further, with a diffuse low intensity signal dissipated within replication compartments, but frequently with tight foci remaining peripherally, representing unreplicated genomes or condensed parental strands of replicated DNA. Uncoating and nuclear entry was independent of proteasome function and resistant to inhibitors of nuclear export. Together with additional data our results reveal new insight into the spatiotemporal dynamics of HSV genome uncoating, transport and organisation.


Conflict of interest statement

The authors have declared that no competing interests exist.

Figures

Fig 1
Fig 1. Minimal effect of EdC on HSV-1 replication.
(a) RPE-1 cell monolayers were infected with 50 pfu of HSV-1[17] and incubated in the presence of EdC at various concentrations (added at 2 hpi). Plaques were fixed and stained at 48 hr (scale bar 1 mm). Plaque area (approximately 40 plaques) and plaque numbers at each EdC concentration were quantitated relative to untreated cells (set to 100%). (b) Single-step growth yield assay of HSV-1[17] in the presence of EdC. Cells were infected (moi 5) and incubated with EdC (added at 2 hpi). Supernatant and cell-associated virus was harvested at 20 hpi and titrated on RPE-1 cells. (c) Multi-step growth yield assay. Cells were infected (moi 0.005) and incubated with EdC added at 2 hpi. Virus was harvested at 72 hpi and titrated on RPE-1 cells. (d) Particles/pfu ratios of HSV and HSVEdC. Virus released into the medium and purified by ultracentrifugation was titrated and equal pfu applied to a defined area on coverslips and stained for VP5+ve particles. Multiple fields were imaged and tiled so that all particles in the samples were quantified. The graph indicates total particle counts from the accumulated individual fields and the SD of particle counts within individual fields.
Fig 2
Fig 2. Temporal incorporation of EdC into viral replication compartments.
(a) RPE-1 cells were infected (moi 10) and pulsed with 5 μM EdC for 4 hrs at the times indicated. Cells were fixed and processed for EdC incorporation together with immunofluorescence for ICP8 and counterstained with DAPI staining for total DNA (DAPI). Individual channels are shown in grey scale and the merged images in colour. (b) Using the DAPI channel as a mask, images were then quantified for EdC or ICP8 and the percentage +ve plotted against total cell nuclei count. Images were taken at 10x magnification (scale bar 100 μm).
Fig 3
Fig 3. Distinct patterns of EdC incorporation in viral replication compartments.
Higher magnification images from experiment as described for Fig 2. Cells were processed by cycloaddition for EdC incorporation together with immunofluorescence for ICP8 and counterstained by DAPI staining for total DNA (DAPI). Individual channels are shown in grey scale and the merged images in colour. Images were acquired with an x63 objective (scale bar 10 μm). Patterns of localisation are as discussed in the text.
Fig 4
Fig 4. Quantitation of EdC labelled genomes in individual HSV-1EdC particles.
Equivalent samples of HSV-1EdC or HSV-1[17] at 1x10⁸ pfu/ml were adsorbed onto glass coverslips prior to detection by cycloaddition and immunofluorescence for VP5. Panels I and IV show the merged channel images for each virus (scale bar 10 μm). The inset in panel I shows a magnified section. Panels II and V show only the green channel (genome detection) for each virus. Panels III and VI show the colour-coded outline overlay produced by the ImageJ plugin used for particle analysis (described in materials and methods); yellow indicates particles containing both VP5 capsid protein and EdC genome signal; red indicates VP5+ve particles lacking detectable EdC; green indicates particles with detectable EdC but no VP5. The data for approximately 700 particles are quantified in the right panels for each virus.
Fig 5
Fig 5. HSV-1EdC genomes detected only after cell entry and uncoating.
Cells were infected with (a) HSV-1EdC or (b) HSV-1[17] at moi 10 at 4°C and incubated for 45 min. Cells were then either fixed immediately (4°C), or the temperature was raised to 37°C for 2 hr (4°C → 37°C). Genomes were detected by cycloaddition and capsids by anti-VP5 immunofluorescence (scale bar 10 μm). In each of (a) and (b), panels I and IV show detection of VP5, II and V show detection of EdC labelled genomes, with panels III and VI show the merged image.
Fig 6
Fig 6. Quantitative analysis of genome uncoating at 0.5 hpi.
(ai) Representative high magnification image of an individual cell infected with HSV-1EdC (moi 10) at 0.5 hpi. Infection was as described in Fig 5. The expanded inset shows juxtaposition of uncoated compact genomes (green) and parent capsid (red) (scale bar for main image 10 μm). An example of a nucleus containing more numerous genomes is shown in panel ii. Distributions frequencies of genome numbers for approximately 200 nuclei is shown in panel (b), representing a box and whisker plot for genome number per cell nuclei at 0.5 hpi at increasing moi. Box limits represent 2nd and 3rd quartiles with the horizontal bar in the middle showing the median and whiskers showing up the 5–95% range of the total population. Exceptional outliers (less than 5% of population) are shown as individual dots. The mean value is indicated by a ‘+’. Raw data for this summary is shown in the panel (d) below. (c) Histograms for number of genomes observed in cell nuclei at 0.5 hpi at each moi. Bin width was set at 1 genome and approximately 200 nuclei for each moi were analysed for (b) and (c). (e) Distribution of total labelled foci seen in the cytoplasm versus the nucleus at each moi.
Fig 7
Fig 7. 3D-SIM analysis of genome decompaction.
3D-SIM data of HSVEdC virions adsorbed to glass coverslips as described in Fig 4. (a) Raw data was reconstructed and individual representative particles are shown as Z-projections. Quantitative analysis was carried out on approximately 800 particles via 2D-Gaussian fitting to calculate full width half maxima in each channel with numerical summary data given in the panel. (b) 3D-SIM data of a cell infected with HSV-1EdC (moi 20) and examined at 0.5 hpi. Raw data was visualised by iso-rendering in Huygens analysis software as described in materials and methods (scale bar 1 μm). Red objects denote VP5 capsids, while green objects denote EdC-labelled genomes. Blue object is nuclear DAPI staining. (c) 3D-SIM data of HSV-1EdC genomes on coverslips compared to infected cells at 0.5 hpi and 2 hpi visualised after 3D-SIM by iso-rendering in Huygens analysis software (scale bar 1 μm). Quantitative analysis of genome volume (d) and sphericity (e) is shown as box and whisker plots. Boxes show 2nd and 3rd quartiles with a horizontal bar in the middle showing the median, while whiskers show up to 5–95% of the total population. 50 genomes were analysed for each category. Unpaired two-tailed t-tests were used for statistical results (** = p<0.005, *** = p<0.0001).
Fig 8
Fig 8. Spatiotemporal relationship of genome decompaction and ICP4 expression.
(a) Representative images of cells infected with HSV-1EdC (moi 10). Infection was synchronised as described in Fig 5 and cells fixed at 0.5 hpi (I-IV), 1 hpi (V-VIII), or 3 hpi (IX-XII) with subsequent detection by cycloaddition and immunofluorescence for ICP4 (scale bar 10 μm). Insets from panels VIII and XII are shown magnified in (b) to illustrate a shift from ICP4 association with genome foci immediately after infection but reduced or absence of association on foci remaining at the later times. (c) 3D-SIM data of a cell nucleus infected with HSV-1EdC and fixed at 2 hpi showing residual EdC labelled infecting genomes remaining as tighter foci on the periphery of replication compartments, marked by ICP4 (red) and the absence of significant ICP4 recruitment to those remaining genome foci.
Fig 9
Fig 9. Effects of inhibition of transcription, translation and virus DNA replication on transitions in genome decompaction.
Representative images of cells infected with HSV-1EdC (moi 10) and incubated in the presence of ActD (5 μg/ml), ACV (500 μM), PAA (400 μg/ml), CHX (100 μg/ml), or no treatment. Infection was synchronised as described in Fig 5 and cells fixed at the time points indicated for processing (scale bar 10 μm). Arrows and circles indicate qualitative features of genome localisation under each condition as discussed in the text.
Fig 10
Fig 10. Comparison of the effects of inhibition of transcription versus translation on infecting genome localisation.
(a) Infection and analysis as for Fig 9 in this case extended until 8 hpi, revealing the maintenance of tight condensed foci in the presence of Act D. (b) Comparison of genome localisation at 3 hpi in Act D treated versus CHX treated cells. Circles indicate the feature of genome clustering seen in CHX treated cell as opposed to the more typical individual foci (arrowed) for Act D. (c) The SDI distribution among populations of Act D and CHX treated cells were calculated as discussed in the text and materials and methods. SDIs close to 1 indicate a tendency to dispersion while closer to 0 indicates clustering. The differences in SDI frequency distributions between Act D and CHX were highly significant with that of CHX reflecting a clear trend to clustering. Histograms of the SDI were calculated from 50 nuclei from each group and the difference in distributions calculated using the Kolmogorov-Smirnoff test (p < 0.0001, D = 0.52). (d) Independent estimation of clustering by calculation of the K-function at increasing length of test radii. Data shown are the mean +/- sem of the K function for radii between 0.11μm and 6 μm, with corresponding low and high quantiles (0.01 and 0.99 respectively) for 47 cells treated with Act D and 52 cells treated with CHX. The tendency towards clustering is highly significant for the CHX treated cells.
Fig 11
Fig 11. Effects of drug treatment on genome nuclear entry.
Cells were mock-treated or treated with MG132 (10 μM), Leptomycin B (20 nM) or nocodazole (2 μM) as indicated. Inhibitors were added to cells for 1 hr prior to infection with HSVEdC (moi 10). Cells were analysed at 0.5 hpi for the localisation of EdC-labeled genomes as described for other figures. For MG132 we also analysed genome localisation at 1 hr. (a) Each panels shows a representative image at high magnification (x63 objective) together with histograms of quantitative evaluation of the frequency of numbers of genomes/nucleus observed for each condition (at least 200 nuclei for each). (b) Box and whisker plots for data in (a). Box shows 2nd and 3rd quartiles with a horizontal bar in the middle showing the median, while whiskers show up to 5–95% of the total population. ‘+’ denotes the mean value. Unpaired two-tailed t-tests were used for statistical results (ns = not statistically significant, *** = p<0.0001). In this experiment infection even in the untreated sample was somewhat less efficient than standard, but there was no significant difference with either MG132 or Leptomycin B at 30 min and no diference for MG132 at 1 hr. In contrast, Nocodazole treatment resulted in a substantial and significant reduction in accumulation of uncoated nuclear genomes as discussed in the text.
Fig 12
Fig 12. Model for HSV genome dynamics in nuclear entry, compaction and ICP4 association.
We propose a model for spatiotemporal dynamics of the infecting HSV genome. The genome is indicated in blue. Progressive phases reflecting observations on certain qualitative features of genome organisation (which will naturally not occur completely synchronously), are demarked as phase 1–4. For clarity and ease of discussion, the inner part of the circle indicates only genomes, while the outer part indicates the association of genomes with the regulatory protein ICP4 (indicated in red). The bottom sections in shaded background indicate features delineated in the presence of inhibitors. Replicated progeny genomes are indicated in phases 3–4 in black. Details of the model are as discussed in the text.

Similar articles

Cited by

References

    1. Whittaker GR, Kann M, Helenius A. Viral entry into the nucleus. Annu Rev Cell Dev Biol. 2000;16:627–51. Epub 2000/10/14. doi: 10.1146/annurev.cellbio.16.1.627 . - DOI - PubMed
    1. Greber UF, Fornerod M. Nuclear import in viral infections. Curr Top Microbiol Immunol. 2005;285:109–38. Epub 2004/12/22. . - PubMed
    1. Greber UF, Fassati A. Nuclear import of viral DNA genomes. Traffic. 2003;4(3):136–43. Epub 2003/03/27. . - PubMed
    1. Zhou L, Sokolskaja E, Jolly C, James W, Cowley SA, Fassati A. Transportin 3 promotes a nuclear maturation step required for efficient HIV-1 integration. PLoS Pathog. 2011;7(8):e1002194 Epub 2011/09/09. doi: 10.1371/journal.ppat.1002194 ; PubMed Central PMCID: PMC3161976. - DOI - PMC - PubMed
    1. Monette A, Pante N, Mouland AJ. HIV-1 remodels the nuclear pore complex. J Cell Biol. 2011;193(4):619–31. Epub 2011/05/18. doi: 10.1083/jcb.201008064 ; PubMed Central PMCID: PMC3166874. - DOI - PMC - PubMed

Substances