Flavin-containing monooxygenase 3 (FMO3) role in busulphan metabolic pathway
- PMID: 29121650
- PMCID: PMC5679629
- DOI: 10.1371/journal.pone.0187294
Flavin-containing monooxygenase 3 (FMO3) role in busulphan metabolic pathway
Erratum in
-
Correction: Flavin-containing monooxygenase 3 (FMO3) role in busulphan metabolic pathway.PLoS One. 2017 Dec 19;12(12):e0190181. doi: 10.1371/journal.pone.0190181. eCollection 2017. PLoS One. 2017. PMID: 29261803 Free PMC article.
Abstract
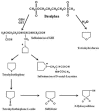
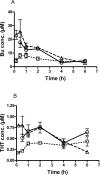
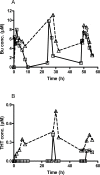
Busulphan (Bu) is an alkylating agent used in the conditioning regimen prior to hematopoietic stem cell transplantation (HSCT). Bu is extensively metabolized in the liver via conjugations with glutathione to form the intermediate metabolite (sulfonium ion) which subsequently is degraded to tetrahydrothiophene (THT). THT was reported to be oxidized forming THT-1-oxide that is further oxidized to sulfolane and finally 3-hydroxysulfolane. However, the underlying mechanisms for the formation of these metabolites remain poorly understood. In the present study, we performed in vitro and in vivo investigations to elucidate the involvement of flavin-containing monooxygenase-3 (FMO3) and cytochrome P450 enzymes (CYPs) in Bu metabolic pathway. Rapid clearance of THT was observed when incubated with human liver microsomes. Furthermore, among different recombinant microsomal enzymes, the highest intrinsic clearance for THT was obtained via FMO3 followed by several CYPs including 2B6, 2C8, 2C9, 2C19, 2E1 and 3A4. In Bu- or THT-treated mice, inhibition of FMO3 by phenylthiourea significantly suppressed the clearance of both Bu and THT. Moreover, the simultaneous administration of a high dose of THT (200μmol/kg) to Bu-treated mice reduced the clearance of Bu. Consistently, in patients undergoing HSCT, repeated administration of Bu resulted in a significant up-regulation of FMO3 and glutathione-S-transfrase -1 (GSTA1) genes. Finally, in a Bu-treated patient, additional treatment with voriconazole (an antimycotic drug known as an FMO3-substrate) significantly altered the Bu clearance. In conclusion, we demonstrate for the first time that FMO3 along with CYPs contribute a major part in busulphan metabolic pathway and certainly can affect its kinetics. The present results have high clinical impact. Furthermore, these findings might be important for reducing the treatment-related toxicity of Bu, through avoiding interaction with other concomitant used drugs during conditioning and hence improving the clinical outcomes of HSCT.
Conflict of interest statement
Figures


Similar articles
-
The association of cytochrome P450 genetic polymorphisms with sulfolane formation and the efficacy of a busulfan-based conditioning regimen in pediatric patients undergoing hematopoietic stem cell transplantation.Pharmacogenomics J. 2014 Jun;14(3):263-71. doi: 10.1038/tpj.2013.38. Epub 2013 Oct 29. Pharmacogenomics J. 2014. PMID: 24165757
-
Influence of glutathione S-transferase A1, P1, M1, T1 polymorphisms on oral busulfan pharmacokinetics in children with congenital hemoglobinopathies undergoing hematopoietic stem cell transplantation.Pediatr Blood Cancer. 2010 Dec 1;55(6):1172-9. doi: 10.1002/pbc.22739. Pediatr Blood Cancer. 2010. PMID: 20672371
-
Glutathione S-transferase gene variations influence BU pharmacokinetics and outcome of hematopoietic SCT in pediatric patients.Bone Marrow Transplant. 2013 Jul;48(7):939-46. doi: 10.1038/bmt.2012.265. Epub 2013 Jan 7. Bone Marrow Transplant. 2013. PMID: 23292236 Clinical Trial.
-
Pharmacogenetic aspects of drug metabolizing enzymes in busulfan based conditioning prior to allogenic hematopoietic stem cell transplantation in children.Curr Drug Metab. 2014 Mar;15(3):251-64. doi: 10.2174/1389200215666140202214012. Curr Drug Metab. 2014. PMID: 24524663 Review.
-
Human flavin-containing monooxygenase (form 3): polymorphisms and variations in chemical metabolism.Pharmacogenomics. 2002 May;3(3):325-39. doi: 10.1517/14622416.3.3.325. Pharmacogenomics. 2002. PMID: 12052141 Review.
Cited by
-
GSTM1 and GSTT1 double null genotypes determining cell fate and proliferation as potential risk factors of relapse in children with hematological malignancies after hematopoietic stem cell transplantation.J Cancer Res Clin Oncol. 2022 Jan;148(1):71-86. doi: 10.1007/s00432-021-03769-2. Epub 2021 Sep 9. J Cancer Res Clin Oncol. 2022. PMID: 34499222 Free PMC article.
-
The presence of busulfan metabolites and pharmacometabolomics in plasma drawn immediately before allograft infusion in hematopoietic cell transplant recipients.Clin Transl Sci. 2023 Dec;16(12):2577-2590. doi: 10.1111/cts.13651. Epub 2023 Oct 10. Clin Transl Sci. 2023. PMID: 37749994 Free PMC article.
-
Mechanisms underlying seizures and hypothermia during busulphan administration.Bone Marrow Transplant. 2025 Aug;60(8):1120-1128. doi: 10.1038/s41409-025-02608-z. Epub 2025 May 3. Bone Marrow Transplant. 2025. PMID: 40319193 Free PMC article.
-
Review of the Pharmacokinetics and Pharmacodynamics of Intravenous Busulfan in Paediatric Patients.Clin Pharmacokinet. 2021 Jan;60(1):17-51. doi: 10.1007/s40262-020-00947-2. Epub 2020 Oct 30. Clin Pharmacokinet. 2021. PMID: 33128207 Review.
-
Reduced Risk of Sinusoidal Obstruction Syndrome of the Liver after Busulfan-Cyclophosphamide Conditioning Prior to Allogeneic Hematopoietic Stem Cell Transplantation.Clin Transl Sci. 2020 Mar;13(2):293-300. doi: 10.1111/cts.12709. Epub 2019 Nov 6. Clin Transl Sci. 2020. PMID: 31675173 Free PMC article.
References
-
- Burt RK, Loh Y, Pearce W, Beohar N, Barr WG, Craig R, et al. (2008) Clinical applications of blood-derived and marrow-derived stem cells for nonmalignant diseases. JAMA 299: 925–936. doi: 10.1001/jama.299.8.925 - DOI - PubMed
-
- Hassan M, Ehrsson H (1987) Metabolism of 14C-busulfan in isolated perfused rat liver. Eur J Drug Metab Pharmacokinet 12: 71–76. - PubMed
-
- Hassan M, Ehrsson H (1987) Urinary metabolites of busulfan in the rat. Drug Metab Dispos 15: 399–402. - PubMed
-
- Hassan M, Ehrsson H, Wallin I, Eksborg S (1988) Pharmacokinetic and metabolic studies of busulfan in rat plasma and brain. Eur J Drug Metab Pharmacokinet 13: 301–305. - PubMed
-
- Hassan M, Svensson JO, Nilsson C, Hentschke P, Al-Shurbaji A, Aschan J, et al. (2000) Ketobemidone may alter busulfan pharmacokinetics during high-dose therapy. Ther Drug Monit 22: 383–385. - PubMed
MeSH terms
Substances
LinkOut - more resources
Full Text Sources
Other Literature Sources

