

Transcriptomics, metabolomics and histology indicate that high-carbohydrate diet negatively affects the liver health of blunt snout bream (Megalobrama amblycephala)
- PMID: 29121861
- PMCID: PMC5680769
- DOI: 10.1186/s12864-017-4246-9
Transcriptomics, metabolomics and histology indicate that high-carbohydrate diet negatively affects the liver health of blunt snout bream (Megalobrama amblycephala)
Abstract
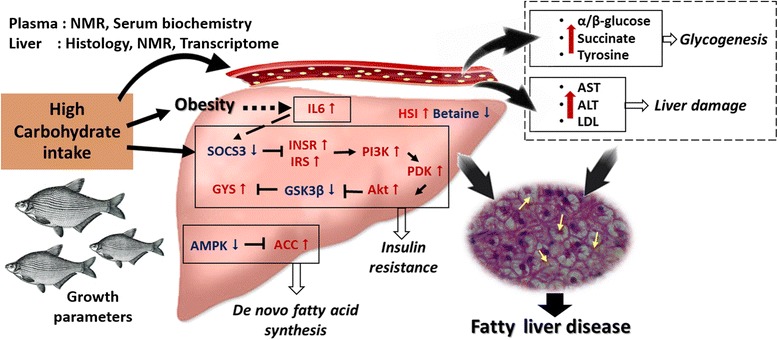
Background: Global trend of the introduction of high levels of relatively cheap carbohydrates to reduce the amount of costly protein in the aquatic animal feed production has affected the aquaculture of an economically important cyprinid fish, blunt snout bream (Megalobrama amblycephala). This dietary shift has resulted in increased prevalence of metabolic disorders, often causing economic losses. High dietary intake of carbohydrates, associated with obesity, is one of the major causes of non-alcoholic fatty liver disease (NAFLD) in humans.
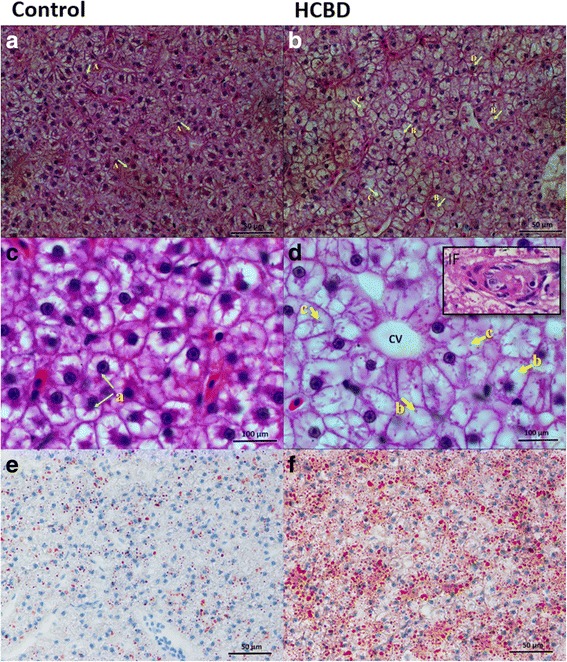
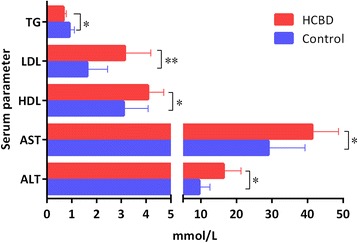
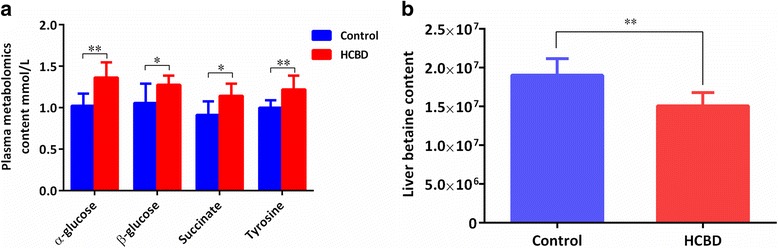
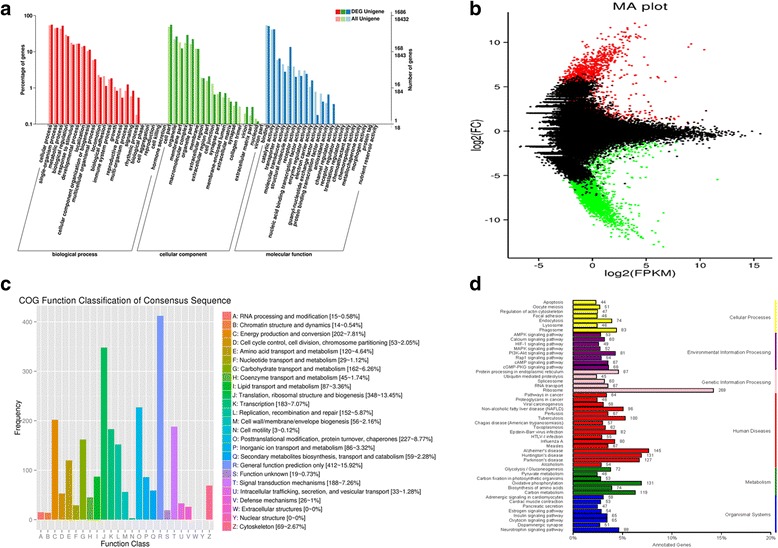
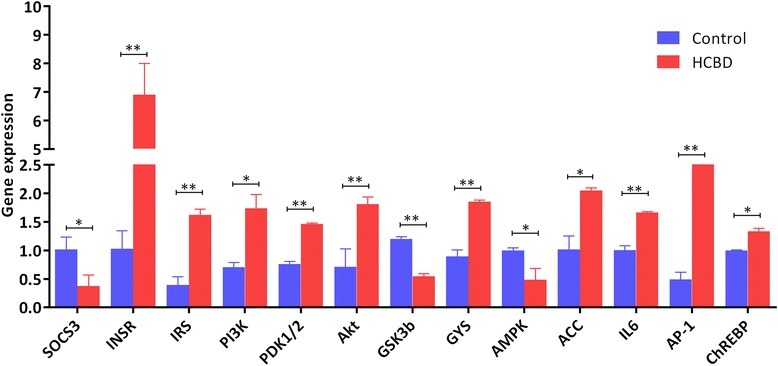
Results: We have conducted an eight-week feeding trial to better understand how a high-carbohydrate diet (HCBD) affects the liver health in this fish. Hepatosomatic index and lipid content were significantly (P < 0.05) higher in the HCBD group. Histology results also suggested pathological changes in the livers of HCBD group, with excessive lipid accumulation and indication of liver damage. Metabolomics and serum biochemistry analyses showed that a number of metabolites indicative of liver damage were increased in the HCBD group. This group also exhibited low levels of betaine, which is a metabolite crucial for maintaining the healthy liver functions. Transcriptomic and qPCR analyses indicated that HCBD had a strong impact on the expression of a large number of genes associated with the NAFLD and insulin signalling pathways, which may lead to the development of insulin resistance in hepatocytes, pathological liver changes, and eventually the NAFLD.
Conclusions: Transcriptomics, metabolomics and histology results all indicate early symptoms of liver damage. However whether these would actually lead to the development of NAFLD after a longer period of time, remains inconclusive. Additionally, a very high number of upregulated genes in the HCBD group associated with several neurodegenerative diseases is a strong indication of neurodegenerative changes caused by the high-carbohydrate diet in blunt snout bream. This suggests that fish might present a good model to study neurodegenerative changes associated with high-carbohydrate diet in humans.
Keywords: Aquaculture; Fish; Hepatosomatic index; NAFLD; Neurodegenerative diseases.
Conflict of interest statement
Ethics approval and consent to participate
Efforts were made to minimize suffering as much as possible, and all animals were handled and experimental procedures conducted in accordance with the guidelines for the care and use of animals for scientific purposes set by the Ministry of Science and Technology, Beijing, China (No. 398, 2006). The study was approved by the Institutional Animal Care and Use Ethics Committee of Huazhong Agricultural University. The permit number for conducting animal experiments of the Huazhong Agricultural University is SCXK(Hubei)2015–0019.
Consent for publication
Not applicable
Competing interests
The authors declare that they have no competing interests.
Publisher’s Note
Springer Nature remains neutral with regard to jurisdictional claims in published maps and institutional affiliations.
Figures
Similar articles
-
Is the Nutritional Value of Fish Fillet Related to Fish Maturation or Fish Age? Integrated Analysis of Transcriptomics and Metabolomics in Blunt Snout Bream (Megalobrama amblycephala).Cell Physiol Biochem. 2018;49(1):17-39. doi: 10.1159/000492837. Epub 2018 Aug 22. Cell Physiol Biochem. 2018. PMID: 30134220
-
Tryptophan supplements in high-carbohydrate diets by improving insulin response and glucose transport through PI3K-AKT-GLUT2 pathways in blunt snout bream (Megalobrama amblycephala).J Nutr Biochem. 2024 Dec;134:109715. doi: 10.1016/j.jnutbio.2024.109715. Epub 2024 Aug 9. J Nutr Biochem. 2024. PMID: 39127308
-
Metabolite and gene expression profiles suggest a putative mechanism through which high dietary carbohydrates reduce the content of hepatic betaine in Megalobrama amblycephala.Metabolomics. 2018 Jul 4;14(7):94. doi: 10.1007/s11306-018-1389-x. Metabolomics. 2018. PMID: 30830423
-
Effects of dietary glucose and starch levels on the growth, apparent digestibility, and skin-associated mucosal non-specific immune parameters in juvenile blunt snout bream (Megalobrama amblycephala).Fish Shellfish Immunol. 2018 Aug;79:193-201. doi: 10.1016/j.fsi.2018.05.001. Epub 2018 May 4. Fish Shellfish Immunol. 2018. PMID: 29733960
-
Effect of dietary betaine on growth performance, antioxidant capacity and lipid metabolism in blunt snout bream fed a high-fat diet.Fish Physiol Biochem. 2017 Dec;43(6):1733-1745. doi: 10.1007/s10695-017-0405-9. Epub 2017 Sep 30. Fish Physiol Biochem. 2017. PMID: 28963592 Clinical Trial.
Cited by
-
Metabolomic Hallmarks of Obesity and Metabolic Dysfunction-Associated Steatotic Liver Disease.Int J Mol Sci. 2024 Nov 28;25(23):12809. doi: 10.3390/ijms252312809. Int J Mol Sci. 2024. PMID: 39684520 Free PMC article. Review.
-
Dietary succinic acid mitigates adverse effects of starch high-starch diet in largemouth bass (Micropterus salmoides) through gut-liver axis modulation.Fish Physiol Biochem. 2025 Aug 13;51(4):142. doi: 10.1007/s10695-025-01557-0. Fish Physiol Biochem. 2025. PMID: 40802136
-
Fenofibrate Improves Insulin Resistance and Hepatic Steatosis and Regulates the Let-7/SERCA2b Axis in High-Fat Diet-Induced Non-Alcoholic Fatty Liver Disease Mice.Front Pharmacol. 2022 Jan 19;12:770652. doi: 10.3389/fphar.2021.770652. eCollection 2021. Front Pharmacol. 2022. PMID: 35126113 Free PMC article.
-
Evaluation of the efficacy of mitochondrial fission inhibitor (Mdivi-1) using non-alcoholic steatohepatitis (NASH) liver organoids.Front Pharmacol. 2023 Oct 12;14:1243258. doi: 10.3389/fphar.2023.1243258. eCollection 2023. Front Pharmacol. 2023. PMID: 37900170 Free PMC article.
-
Dietary Macroalgae Saccharina japonica Ameliorates Liver Injury Induced by a High-Carbohydrate Diet in Swamp Eel (Monopterus albus).Front Vet Sci. 2022 Jun 14;9:869369. doi: 10.3389/fvets.2022.869369. eCollection 2022. Front Vet Sci. 2022. PMID: 35774985 Free PMC article.
References
-
- Wilson RP. Utilization of dietary carbohydrate by fish. Aquaculture. 1994;124:67–80. doi: 10.1016/0044-8486(94)90363-8. - DOI
-
- Ren M, Habte-Tsion HM, Xie J, Liu B, Zhou Q, Ge X, et al. Effects of dietary carbohydrate source on growth performance, diet digestibility and liver glucose enzyme activity in blunt snout bream, Megalobrama Amblycephala. Aquaculture. 2015;438:75–81. doi: 10.1016/j.aquaculture.2015.01.008. - DOI
MeSH terms
Substances
Grants and funding
LinkOut - more resources
Full Text Sources
Other Literature Sources
Medical
