Comparative Study
. 2017 Nov 9;15(1):79.
doi: 10.1186/s12951-017-0312-3.

Quantifying engineered nanomaterial toxicity: comparison of common cytotoxicity and gene expression measurements

Affiliations
Comparative Study

Quantifying engineered nanomaterial toxicity: comparison of common cytotoxicity and gene expression measurements

Donald H Atha et al. J Nanobiotechnology. .

Abstract

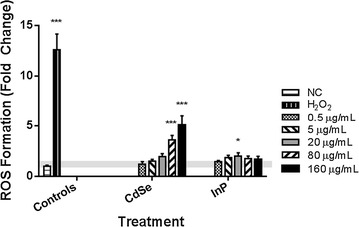
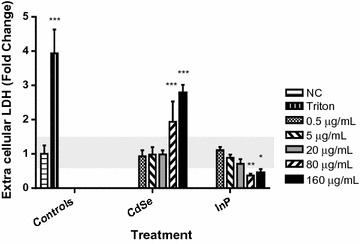
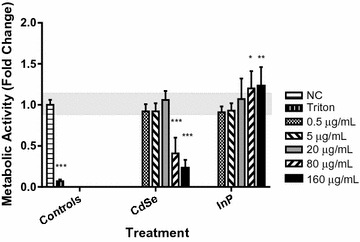
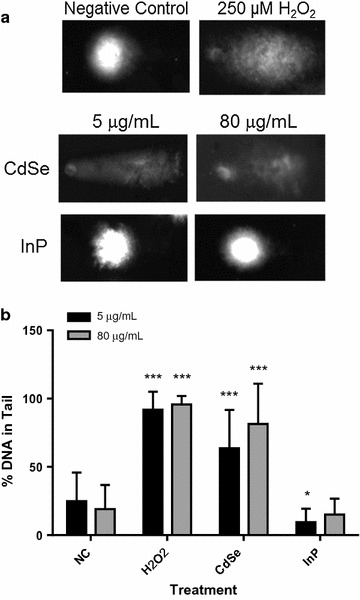
Background: When evaluating the toxicity of engineered nanomaterials (ENMS) it is important to use multiple bioassays based on different mechanisms of action. In this regard we evaluated the use of gene expression and common cytotoxicity measurements using as test materials, two selected nanoparticles with known differences in toxicity, 5 nm mercaptoundecanoic acid (MUA)-capped InP and CdSe quantum dots (QDs). We tested the effects of these QDs at concentrations ranging from 0.5 to 160 µg/mL on cultured normal human bronchial epithelial (NHBE) cells using four common cytotoxicity assays: the dichlorofluorescein assay for reactive oxygen species (ROS), the lactate dehydrogenase assay for membrane viability (LDH), the mitochondrial dehydrogenase assay for mitochondrial function, and the Comet assay for DNA strand breaks.

Results: The cytotoxicity assays showed similar trends when exposed to nanoparticles for 24 h at 80 µg/mL with a threefold increase in ROS with exposure to CdSe QDs compared to an insignificant change in ROS levels after exposure to InP QDs, a twofold increase in the LDH necrosis assay in NHBE cells with exposure to CdSe QDs compared to a 50% decrease for InP QDs, a 60% decrease in the mitochondrial function assay upon exposure to CdSe QDs compared to a minimal increase in the case of InP and significant DNA strand breaks after exposure to CdSe QDs compared to no significant DNA strand breaks with InP. High-throughput quantitative real-time polymerase chain reaction (qRT-PCR) data for cells exposed for 6 h at a concentration of 80 µg/mL were consistent with the cytotoxicity assays showing major differences in DNA damage, DNA repair and mitochondrial function gene regulatory responses to the CdSe and InP QDs. The BRCA2, CYP1A1, CYP1B1, CDK1, SFN and VEGFA genes were observed to be upregulated specifically from increased CdSe exposure and suggests their possible utility as biomarkers for toxicity.

Conclusions: This study can serve as a model for comparing traditional cytotoxicity assays and gene expression measurements and to determine candidate biomarkers for assessing the biocompatibility of ENMs.

Keywords: Biomarkers; Comet assay; Cytotoxicity; Gene expression; Genotoxicity; Nanomaterials; Quantum dots.


Figures

Fig. 1
Fig. 1
MUA-coated CdSe QDs cause increased ROS formation in NHBE cells. NHBE cells were incubated with increasing concentrations of 5 nm CdSe and InP QDs for 24 h. A significant concentration-dependent increase (p < 0.0001) in ROS formation was observed for cells treated with CdSe QDs compared to the medium only negative control (NC), shaded horizontal baseline and 100 μmol/L H2O2 positive control. InP QDs caused significant ROS after exposure to 20 μg/mL, but this response was not dose dependent. *p < 0.01, ***p < 0.0001. All experiments were independently repeated three times (n = 3). Error bars indicate one standard deviation from the mean (σ). Shaded baseline indicates expanded uncertainty (2σ)
Fig. 2
Fig. 2
Concentration-dependent increase in extracellular lactate dehydrogenase (LDH) release for cells treated with CdSe QDsand lack of increase in LDH for cells exposed to increasing concentrations of InP QDs. NHBE cells were incubated with increasing concentrations of 5 nm QDs for 24 h. A significant concentration-dependent increase (p < 0.0001) in LDH release was observed for cells treated with CdSe QDs at 80 and 160 μg, without a corresponding increase for cells exposed to InP QDs, compared to the medium only negative control (NC), shaded horizontal baseline and 0.5% Triton-100 positive control. ***p < 0.0001; **p < 0.001; *p < 0.01. All experiments were independently repeated three times (n = 3). Error bars represent standard deviation from the mean (σ). Shaded baseline indicates expanded uncertainty (2σ)
Fig. 3
Fig. 3
Dose-dependent decrease in mitochondrial function assay for cells treated with CdSe QDs and increase in mitochondial function for cells exposed to InP QDs. NHBE cells were incubated with increasing concentrations of QDs for 24 h. A significant dose-dependent decrease (p < 0.0001) in mitochondrial function was observed for cells treated with the highest concentrations of CdSe QDs, while a significant increase in mitochondrial function was noted for cells exposed to the highest concentrations of InP QDs, compared to the medium only negative control (NC), shaded horizontal baseline and 0.5% triton-100 positive control. ***p < 0.0001; **p < 0.001; *p < 0.01. All experiments were independently repeated three times (n = 3). Error bars represent standard deviation from the mean (σ), Shaded baseline indicates expanded uncertainty (2σ)
Fig. 4
Fig. 4
Comet assay of NHBE cells exposed to CdSe or InP QDs. NHBE cells were incubated with 5 or 80 µg/mL CdSe or InP QDs for 24 h and oxidative DNA damage (strand breaks) was measured by comet assay. a Typical microscopic images of single comets from cells exposed to CdSe or InP QDs compared to medium only negative and positive H2O2 controls. b A significant increase in (p < 0.0001) in DNA damage was observed for cells treated with both 5 and 80 μg/mL CdSe QDs compared to two sets of medium only negative controls (matched to 5 and 80 μg/mL experiments). Two sets of 250 μmol/L H2O2 positive controls (matched to 5 and 80 μg/mL experiments) are also shown for comparison. No DNA damage was apparent in cells exposed to InP QDs.***p < 0.0001; *p < 0.01. Error bars represent one standard deviation (n = 30 cells)

Similar articles

Cited by

References

    1. Borm PJ, Robbins D, Haubold S, Kuhlbusch T, Fissan H, Donaldson K, Schins R, Stone V, Kreyling W, Lademann J, Krutmann J, Warheit D, Oberdorster E. The potential risks of nanomaterials: a review carried out for ECETOC. Part Fibre Toxicol. 2006;3:1–35. doi: 10.1186/1743-8977-3-11. - DOI - PMC - PubMed
    1. Pal BN, Ghosh Y, Brovelli S, Laocharoensuk R, Klimov VI, Hollingsworth JA, Htoon H. Giant CdSe/CdS core/shell nanocrystal quantum dots as efficient electroluminescent materials: strong influence of shell thickness on light-emitting diode performance. Nano Lett. 2012;12:331–336. doi: 10.1021/nl203620f. - DOI - PubMed
    1. Milliron DJ, Hughes SM, Cui Y, Manna L, Li J, Wang L-W, Paul Alivisatos A. Colloidal nanocrystal heterostructures with linear and branched topology. Nature. 2004;430:190–195. doi: 10.1038/nature02695. - DOI - PubMed
    1. Mocatta D, Cohen G, Schattner J, Millo O, Rabani E, Banin U. Heavily doped semiconductor nanocrystal quantum dots. Science. 2011;332:77–81. doi: 10.1126/science.1196321. - DOI - PubMed
    1. Hu M, Yan J, He Y, Lu H, Weng L, Song S, Fan C, Wang L. Ultrasensitive, multiplexed detection of cancer biomarkers directly in serum by using a quantum dot-based microfluidic protein chip. ACS Nano. 2010;4:488–494. doi: 10.1021/nn901404h. - DOI - PubMed

Publication types

MeSH terms