

Efferent modulation of pre-neural and neural distortion products
- PMID: 29122423
- PMCID: PMC5705265
- DOI: 10.1016/j.heares.2017.10.009
Efferent modulation of pre-neural and neural distortion products
Abstract
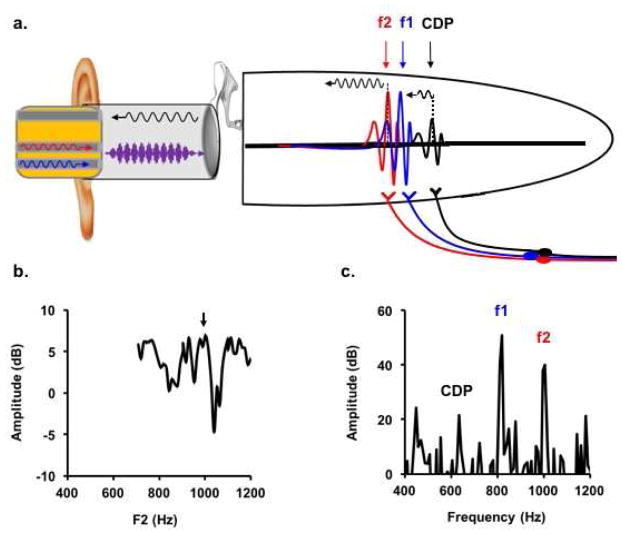
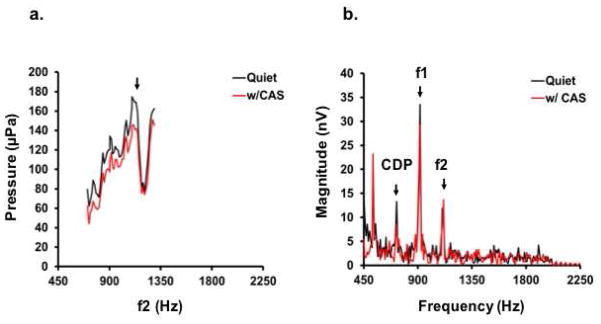
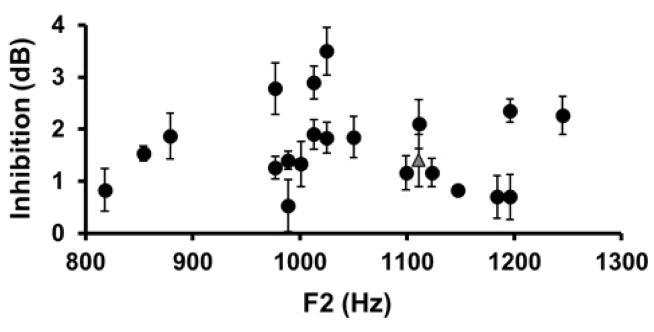
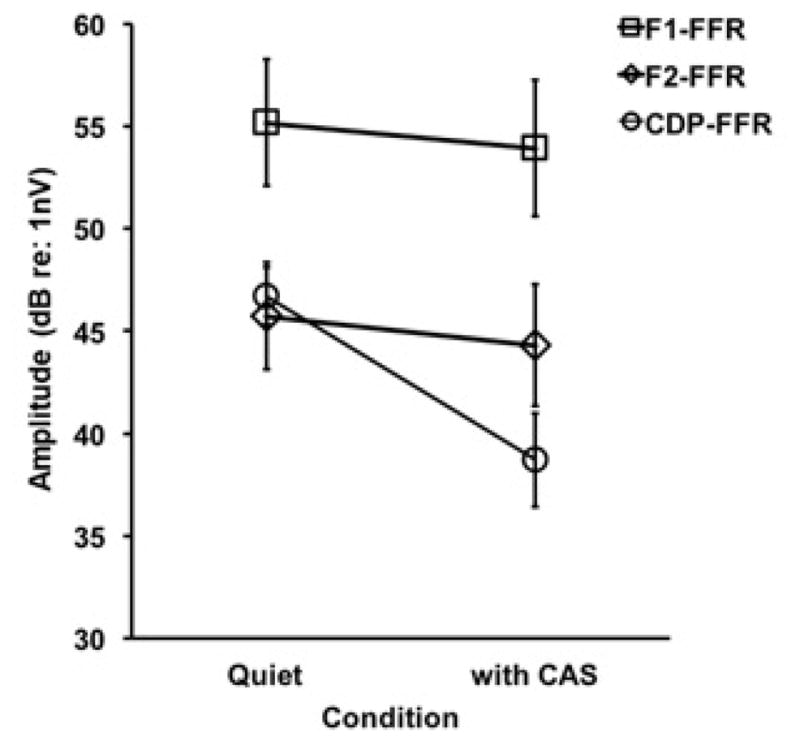
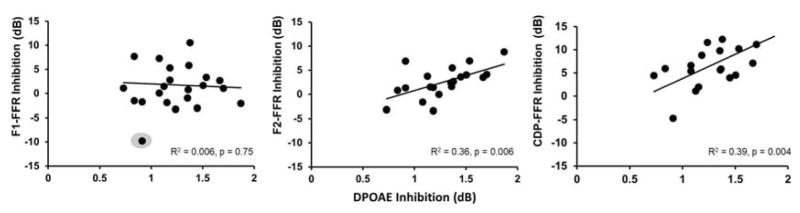
Distortion product otoacoustic emissions (DPOAEs) and distortion product frequency following responses (DPFFRs) are respectively pre-neural and neural measurements associated with cochlear nonlinearity. Because cochlear nonlinearity is putatively linked to outer hair cell electromotility, DPOAEs and DPFFRs may provide complementary measurements of the human medial olivocochlear (MOC) reflex, which directly modulates outer hair cell function. In this study, we first quantified MOC reflex-induced DPOAE inhibition at spectral fine structure peaks in 22 young human adults with normal hearing. The f1 and f2 tone pairs producing the largest DPOAE fine structure peak for each subject were then used to evoke DPFFRs with and without MOC reflex activation to provide a related neural measure of efferent inhibition. We observed significant positive relationships between DPOAE fine structure peak inhibition and inhibition of DPFFR components representing neural phase locking to f2 and 2f1-f2, but not f1. These findings may support previous observations that the MOC reflex inhibits DPOAE sources differentially. That these effects are maintained and represented in the auditory brainstem suggests that the MOC reflex may exert a potent influence on subsequent subcortical neural representation of sound.
Keywords: Distortion product otoacoustic emissions; Efferent; Frequency following response; Medial olivocochlear reflex.
Copyright © 2017 Elsevier B.V. All rights reserved.
Figures
Similar articles
-
Medial olivocochlear efferent reflex inhibition of human cochlear nerve responses.Hear Res. 2016 Mar;333:216-224. doi: 10.1016/j.heares.2015.09.001. Epub 2015 Sep 11. Hear Res. 2016. PMID: 26364824 Free PMC article.
-
Olivocochlear reflex effect on human distortion product otoacoustic emissions is largest at frequencies with distinct fine structure dips.Hear Res. 2007 Jan;223(1-2):83-92. doi: 10.1016/j.heares.2006.10.001. Epub 2006 Nov 29. Hear Res. 2007. PMID: 17137736
-
Influence of aging on medial olivocochlear system function.Clin Interv Aging. 2014 Jun 10;9:901-14. doi: 10.2147/CIA.S61934. eCollection 2014. Clin Interv Aging. 2014. PMID: 24959071 Free PMC article.
-
Morphofunctional alterations in the olivocochlear efferent system of the genetic audiogenic seizure-prone hamster GASH:Sal.Epilepsy Behav. 2017 Jun;71(Pt B):193-206. doi: 10.1016/j.yebeh.2016.05.040. Epub 2016 Aug 1. Epilepsy Behav. 2017. PMID: 27492627 Review.
-
Cochlear efferent innervation and function.Curr Opin Otolaryngol Head Neck Surg. 2010 Oct;18(5):447-53. doi: 10.1097/MOO.0b013e32833e05d6. Curr Opin Otolaryngol Head Neck Surg. 2010. PMID: 20717032 Free PMC article. Review.
Cited by
-
The role of the medial olivocochlear reflex in psychophysical masking and intensity resolution in humans: a review.J Neurophysiol. 2021 Jun 1;125(6):2279-2308. doi: 10.1152/jn.00672.2020. Epub 2021 Apr 28. J Neurophysiol. 2021. PMID: 33909513 Free PMC article. Review.
-
Olivocochlear Efferents in Animals and Humans: From Anatomy to Clinical Relevance.Front Neurol. 2018 Mar 26;9:197. doi: 10.3389/fneur.2018.00197. eCollection 2018. Front Neurol. 2018. PMID: 29632514 Free PMC article. Review.
-
Rapid Enhancement of Subcortical Neural Responses to Sine-Wave Speech.Front Neurosci. 2021 Dec 20;15:747303. doi: 10.3389/fnins.2021.747303. eCollection 2021. Front Neurosci. 2021. PMID: 34987356 Free PMC article.
-
Estimation of efferent inhibition and speech in noise perception on vocal musicians and music sleepers: A comparative study.J Otol. 2023 Apr;18(2):91-96. doi: 10.1016/j.joto.2023.02.001. Epub 2023 Feb 8. J Otol. 2023. PMID: 37153705 Free PMC article. No abstract available.
-
Effects of contralateral noise on envelope-following responses, auditory-nerve compound action potentials, and otoacoustic emissions measured simultaneously.J Acoust Soc Am. 2024 Mar 1;155(3):1813-1824. doi: 10.1121/10.0025137. J Acoust Soc Am. 2024. PMID: 38445988 Free PMC article.
References
-
- Abdala C. Distortion product otoacoustic emission (2 f 1- f 2) amplitude as a function of f 2/f 1 frequency ratio and primary tone level separation in human adults and neonates. The Journal of the Acoustical Society of America. 1996;100(6):3726–3740. - PubMed
-
- Abel C, Wittekindt A, Kössl M. Contralateral acoustic stimulation modulates low-frequency biasing of DPOAE: efferent influence on cochlear amplifier operating state? Journal of neurophysiology. 2009;101(5):2362–2371. - PubMed
-
- Arnold S, Burkard R. The auditory evoked potential difference tone and cubic difference tone measured from the inferior colliculus of the chinchilla. The Journal of the Acoustical Society of America. 1998;104(3 Pt 1):1565–1573. - PubMed
Publication types
MeSH terms
Grants and funding
LinkOut - more resources
Full Text Sources
Other Literature Sources
Miscellaneous
