

Spinal Cord Gray Matter Atrophy in Amyotrophic Lateral Sclerosis
- PMID: 29122760
- PMCID: PMC7410702
- DOI: 10.3174/ajnr.A5427
Spinal Cord Gray Matter Atrophy in Amyotrophic Lateral Sclerosis
Abstract
Background and purpose: There is an emerging need for biomarkers to better categorize clinical phenotypes and predict progression in amyotrophic lateral sclerosis. This study aimed to quantify cervical spinal gray matter atrophy in amyotrophic lateral sclerosis and investigate its association with clinical disability at baseline and after 1 year.
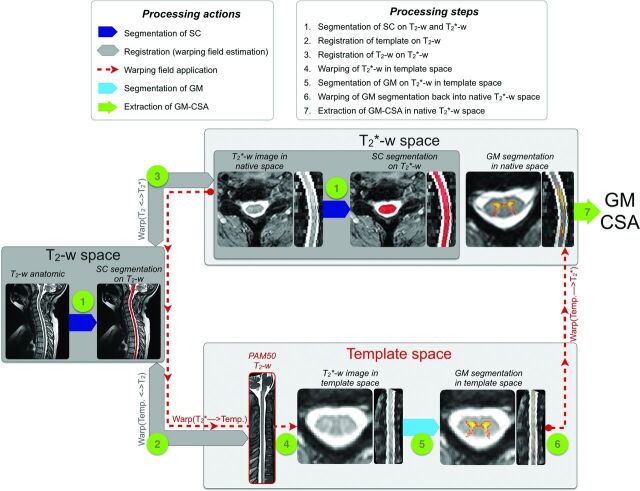
Materials and methods: Twenty-nine patients with amyotrophic lateral sclerosis and 22 healthy controls were scanned with 3T MR imaging. Standard functional scale was recorded at the time of MR imaging and after 1 year. MR imaging data were processed automatically to measure the spinal cord, gray matter, and white matter cross-sectional areas. A statistical analysis assessed the difference in cross-sectional areas between patients with amyotrophic lateral sclerosis and controls, correlations between spinal cord and gray matter atrophy to clinical disability at baseline and at 1 year, and prediction of clinical disability at 1 year.
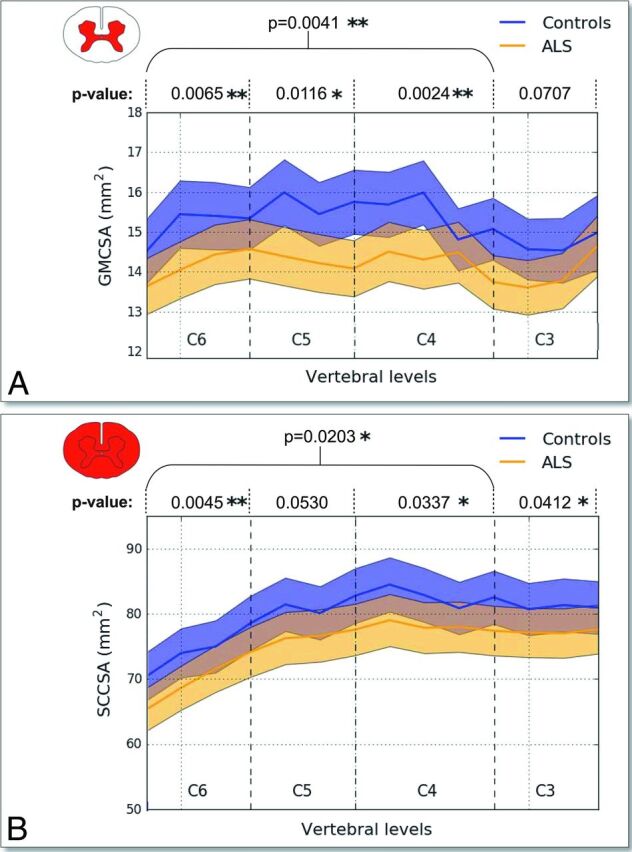
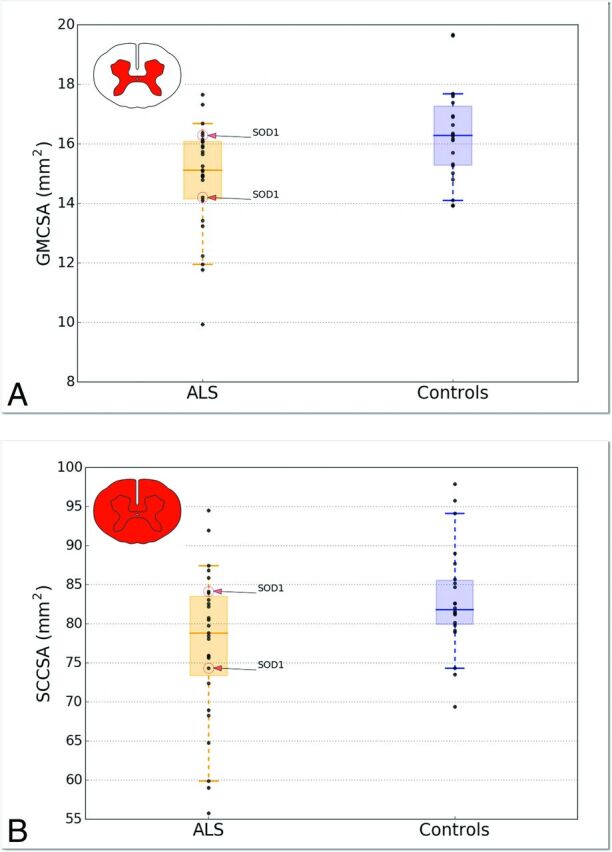
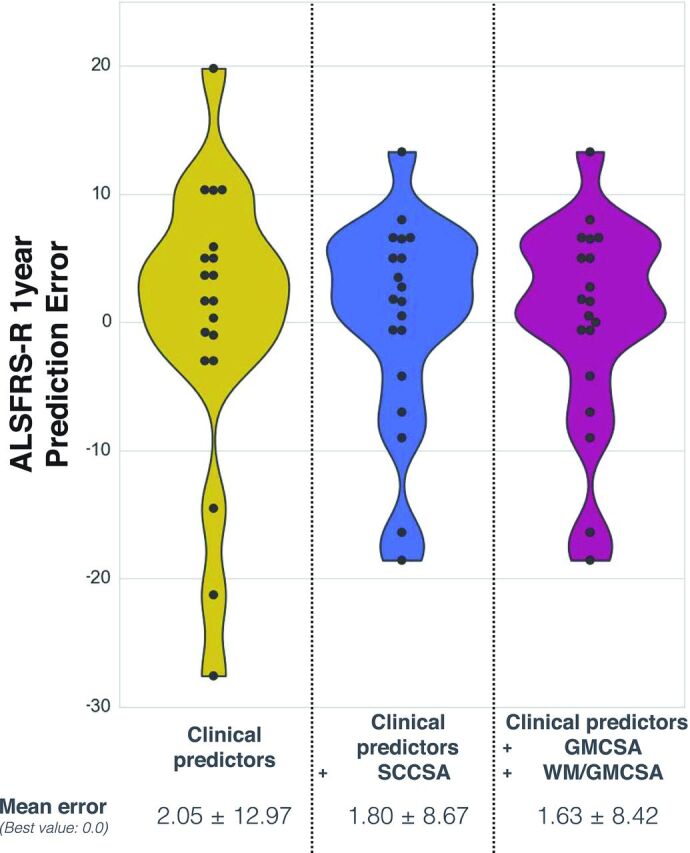
Results: Gray matter atrophy was more sensitive to discriminate patients with amyotrophic lateral sclerosis from controls (P = .004) compared with spinal cord atrophy (P = .02). Gray matter and spinal cord cross-sectional areas showed good correlations with clinical scores at baseline (R = 0.56 for gray matter and R = 0.55 for spinal cord; P < .01). Prediction at 1 year with clinical scores (R2 = 0.54) was improved when including a combination of gray matter and white matter cross-sectional areas (R2 = 0.74).
Conclusions: Although improvements over spinal cord cross-sectional areas were modest, this study suggests the potential use of gray matter cross-sectional areas as an MR imaging structural biomarker to monitor the evolution of amyotrophic lateral sclerosis.
© 2018 by American Journal of Neuroradiology.
Figures
Similar articles
-
Cervical spinal cord atrophy in amyotrophic lateral sclerosis across disease stages.Ann Clin Transl Neurol. 2023 Feb;10(2):213-224. doi: 10.1002/acn3.51712. Epub 2023 Jan 4. Ann Clin Transl Neurol. 2023. PMID: 36599092 Free PMC article.
-
Measurement of spinal cord atrophy using phase sensitive inversion recovery (PSIR) imaging in motor neuron disease.PLoS One. 2018 Nov 29;13(11):e0208255. doi: 10.1371/journal.pone.0208255. eCollection 2018. PLoS One. 2018. PMID: 30496320 Free PMC article.
-
Cervical and thoracic spinal cord gray matter atrophy is associated with disability in patients with amyotrophic lateral sclerosis.Eur J Neurol. 2024 Jun;31(6):e16268. doi: 10.1111/ene.16268. Epub 2024 Mar 11. Eur J Neurol. 2024. PMID: 38465478 Free PMC article.
-
Neuroimaging in amyotrophic lateral sclerosis: current and emerging uses.Expert Rev Neurother. 2018 May;18(5):395-406. doi: 10.1080/14737175.2018.1463160. Epub 2018 Apr 15. Expert Rev Neurother. 2018. PMID: 29630421 Review.
-
Spinal Cord Atrophy in Multiple Sclerosis: A Systematic Review and Meta-Analysis.J Neuroimaging. 2018 Nov;28(6):556-586. doi: 10.1111/jon.12553. Epub 2018 Aug 13. J Neuroimaging. 2018. PMID: 30102003
Cited by
-
Optimized multi-echo gradient-echo magnetic resonance imaging for gray and white matter segmentation in the lumbosacral cord at 3 T.Sci Rep. 2022 Oct 3;12(1):16498. doi: 10.1038/s41598-022-20395-1. Sci Rep. 2022. PMID: 36192560 Free PMC article.
-
Quantitative cervical cord MRI in spinal muscular atrophy: a sensitive imaging biomarker of disease evolution and treatment.J Neurol. 2025 Jun 24;272(7):475. doi: 10.1007/s00415-025-13205-x. J Neurol. 2025. PMID: 40553176 Free PMC article.
-
Spinal Cord Imaging in Amyotrophic Lateral Sclerosis: Historical Concepts-Novel Techniques.Front Neurol. 2019 Apr 12;10:350. doi: 10.3389/fneur.2019.00350. eCollection 2019. Front Neurol. 2019. PMID: 31031688 Free PMC article. Review.
-
Spatial distribution of multiple sclerosis lesions in the cervical spinal cord.Brain. 2019 Mar 1;142(3):633-646. doi: 10.1093/brain/awy352. Brain. 2019. PMID: 30715195 Free PMC article.
-
Spinal cord gray matter segmentation using deep dilated convolutions.Sci Rep. 2018 Apr 13;8(1):5966. doi: 10.1038/s41598-018-24304-3. Sci Rep. 2018. PMID: 29654236 Free PMC article.
References
-
- Blumenfeld H. Neuroanatomy through Clinical Cases. Sunderland, Massachusetts: Sinauer Associates; 2010
Publication types
MeSH terms
LinkOut - more resources
Full Text Sources
Other Literature Sources
Medical